


The Commodity Channel Index indicator was designed by Donald Lambert and fits into the category of being a momentum indicator for those involved in technical analysis. Due to the lines on the indicator, it is often used as an oversold and overbought indicator.
That can often be a flawed use of the CCI considering it is a momentum oscillator that is designed to show momentum in the market. It stands to reason that if a market has enough momentum to drive the CCI into overbought territory, that indicates the market is strong.
Some will argue that an overbought market is in line to reverse at least temporarily. There’s a saying that a market can remain overbought longer than you can remain solvent.
I agree. Many traders loving trading reversals in the market and use the CCI to justify their opinion that the market “is due for a pullback“.
The designer, Donald Lambert, actually looked at oversold or overbought conditions as a reason to trade in that direction with the theory that strength in the market is a good thing.
If the CCI goes above the + 100 line, that’s a signal to establish a long position. When the CCI drops below the + 100 line, the long position is closed out. The same techniques apply to short positions at the -100 line. You can modify the CCI to set your own parameters.
You just have to rely on a trading plan that has specific criteria for entering the market so you are not depending on a lagging indicator for the basis of your trading.
How To Calculate CCI
The good thing is that most charting platforms have the CCI built into their indicator selection. It never hurts to have an understanding of how the CCI is calculated to help you fully understand the nuances of this trading indicator.
CCI = (Typical Price – 20 Period SMA of Typical price) / (.015 x Mean Deviation)
Typical Price = (High + Low + Close)/3
Keep in mind that some traders may alter how the typical price is calculated but for now, just focus on the accepted calculation.
Why is 0.15 used? Here is how Lambert explained that figure:
The use of a .015 constant in the CCI formula scales the resulting CCI value so 70% to 80% of the random fluctuations fall within a +100% to -100% channel
What that means that if the Commodity Channel Index heads into the oversold or overbought condition, that is outside the normal fluctuations of a market. That indicates strength (or weakness) and is a good time to either place a trade or exit one you are currently in.
5 THINGS YOU NEED TO KNOW ABOUT CCI INDICATOR
- CCI is an indicator that is classified as an oscillator. Oscillators tend to have levels that indicates overbought or oversold.
- If the price of a currency pair is overbought then it would read over +100. What this means is the the currency pair’s price has risen with momentum and has deviated from the normal fluctuations of the that market..
- The CCI oscillates below and above zero level.
- When the Commodity channel index reads -100 then the market or price at the time is considered oversold. What this means is the the currency pair’s price has fallen with momentum and has deviated from the normal fluctuations of the that market..
- The CCI is a lagging indicator
To summarize so far: the CCI is an indicator that measures how far apart the price is moving away from the average prices. It the CCI reads overbought or oversold then this tells you that the price has exceeded the normal price movement(the standard deviation) away from the average.
PROBLEMS WITH USING CCI TO TRADE
If you were to follow the trading signals generated by CCI, without any other technical analysis or price action study, then these are the problems you will encounter as shown by the chart below:
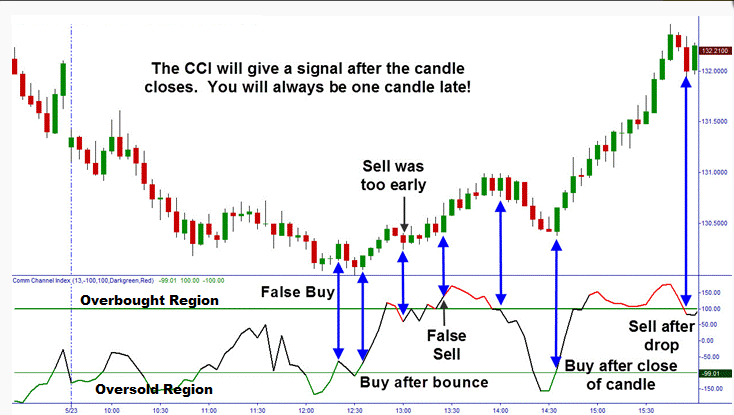
Commodity Channel Index Trade Examples
Notice on the chart above that(starting from left):
- Buy signal was a false buy signal
- Second buy signal by the CCI after it bounced back up from the -100 line was ok and would have resulted in profits.
- Third sell signal given by CCI was false as it was too early
- The 4th trading signal given by the CCI was false as you can see that the trend was still up but yet the commodity channel index indicator gave a sell signal
- The 5th sell signal was good and would have been a profitable trade.
- The 6th buy signal after bouncing up from the -100 CCI line would have been profitable
- The 7th signal was a sell signal generated by CCI and notice that this signal was given after there was already a downward move…thus the statement that because CCI is a lagging indicator, it gives you the signal to trade ” at least one candle after the optimal entry point in price
Why Use The CCI If It Has These Issues?
Trading the CCI all alone by itself will do you no good but having said that, here’s a few reasons for keeping the CCI indicator in your trading tool chest.
- CCI can be useful as a decision-supporting tool
- CCI can be used to identify divergence (CCI Divergence) on the chart
- Help identify overbought or oversold conditions
- It’s a great tool for swing trading and entry triggers
So can we tie all the good things about the CCI into something that we can actually trade as a Forex strategy?
Absolutely.
Two Of The Best Ways to Use The CCI As Part Of A Trading Strategy
- Trading CCI with Moving Averages
- Trading CCI with support and resistance levels
#1: HOW TO TRADE CCI WITH MOVING AVERAGES
The logic for this is very simple: moving averages show us the trend but CCI is an oscillator that just shows us whether the market is oversold or overbought. The CCI cannot tell you about the trend but can tell you about the strength of the trend.
But here’s the problem: you are combining two lagging Forex indicators which will not give you optimum entries.
So to help put the odds in our favor, we are going to look to price action trading to help lessen the lagging issue with all indicators.
Here’s an example:
- We have two moving averages, 9 exponential moving average and 18 exponential moving average and they have just crossed over to the downside: which means there’s a great chance that it’s now a downtrend.
- We do not enter a sell order immediately at the crossover of the moving averages.
- We wait until price rallies back up to the moving averages, and then we look at the CCI to see if it is above the 100 or just crossed below it.
- If that’s the case, then we know we have a sell signal to sell right there. Confirm these trading signals with bearish reversal candlestick patterns as shown on the chart below:
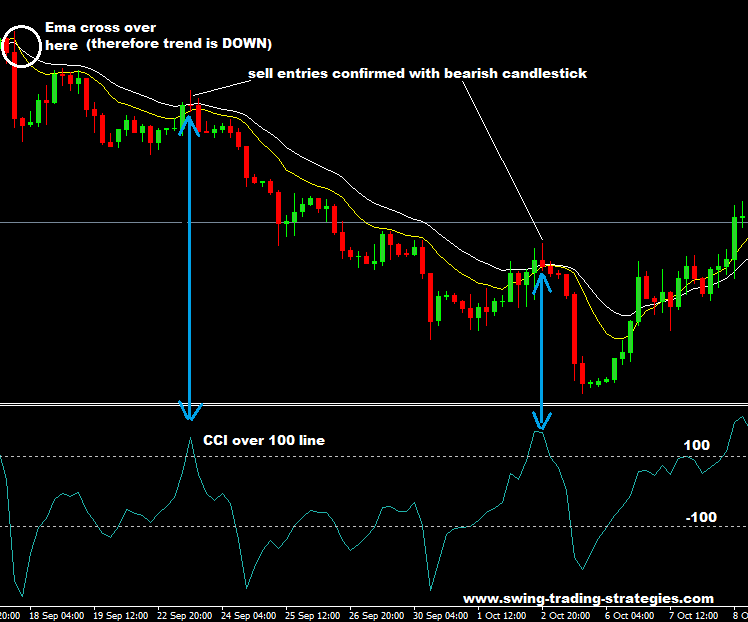
How To Trade CCI With Moving Averages
#2: HOW TO TRADE CCI WITH SUPPORT AND RESISTANCE LEVELS
You first should fully understand how to draw support and resistance levels on your chart. These will give you an objective location to begin looking for a trading setup
- You see price heading down to a support level and then you look at the CCI indicator to see if the market is in an oversold condition.
- If so there’s a likely chance that the market may bounce up from the support level and go up so look for a buy opportunity.
For a buy trade setup, the opposite is true.
- if price is heading up to a resistance level, then look at the Commodity Chanel Index to see if the market is in an overbought condition.
- If so, there’s a great chance that the market may hit the resistance level and head back down.
It is also a good idea to confirm these with bearish reversal candlestick patterns to go short when trading the bounce of a resistance level like shown on the chart below:
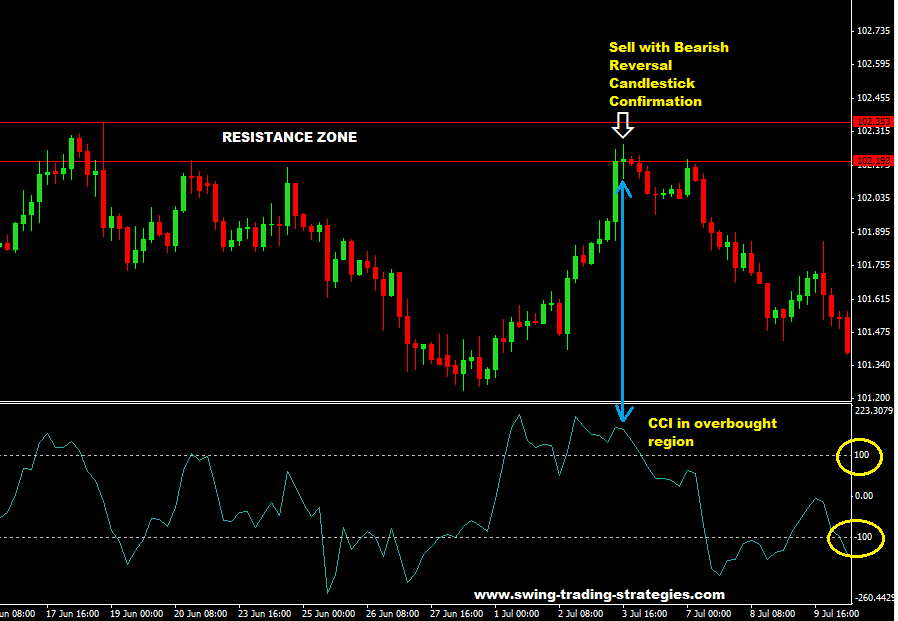
Commodity Channel Index Trading With Support And Resistance Levels
SUMMARY
- These two examples show you you can trade CCI using moving averages and support and resistance levels.
- There may be other ways to trade CCI with a combination of other Forex indicators, Fibonacci or price action trading.
- Adding in price action is a smart idea as this eliminates the lagging factor in your trade entries. I’ve given you two charts above and shown you how this is done.
Keep These CCI Facts In Mind
- You should know is that CCI should never be traded alone. It should be combined with other indicators or price action trading etc to form a trading strategy which you can use.
- CCI is a lagging indicator. You will see that the optimum entry point would have been 1 candlestick back…so what can you do do avoid that?
- CCI divergence is another topic but I don’t find much merit in trading divergence.
- Best option in my opinion is to use price action trading with the use of Forex reversal candlesticks patterns which can allow you to enter at these optimum entry points.
 Posted in