


This Heikin Ashi Forex Trading System is a trading system that allows you to stay in with the trend.
How?
I will explain shortly…
Have you ever closed a trade thinking that the market is going to move in the other direction, only to find out later that it was just a “trick” just to make you panic and you bail out quickly…???
And guess what happens next?
The market continues in the original trend or direction for another 150 pips!
You are now left scratching your head saying “what the heck did I get out…I should have stayed in that freaking trade!”
This is so frustrating and it happens to all traders.
So how do you solve this or have something tell you not to get out but stay in that trade?
Well…?
Heikin Ashi Candlestick to the rescue!
WHAT ARE HEIKEN ASHI CANDLESTICKS?
The Heiken Ashi candlestick chart looks like the real candlestick chart but there’s a difference:
- in a candlestick chart, each candlestick has four different prices which are: open, high, low & close. Each candlestick that is formed after has not relationship with the one the formed previously.
- But with heikin ashi candlestick, each candlestick is calculated using some information from the previous candlestick:
If you wan’t to know more here is a brief detail of how the heikin ashi candlesticks calculated and plotted:
- Open price=average of the open and close of the previous candlestick
- High price=is chosen from the one of the high, open and close price of which has the highest value.
- Low price=is chosen from the one of the high, open and close price which has the lowest value
- Close price=is the average of the open, close, high and low prices.
Which means each candlestick that is formed on the heikin ashi chart is related to the previous one before it-therefore it causes the heikin ashi to delay-just like a moving average indicator.
TRADING USE OF HEIKIN ASHI
Heikin Ashi candlestick charts are used in the same manner as a normal candlesticks.
However there is an additional feature of heikin ashi that makes them different from standard candlestick charts and it is this:
- the colour of the heikin ashi candlestick is supposed to indicate the overall trend direction of the market
- which means it ignores the intermediate trend direction which is happening. In other words, it avoids the noise.
In summary: heikin ashi candlestick chart patterns allow you to stay with the overall trend by allowing your to avoid the noise or the minor fluctuations of price that is prevalent in a standard candlestick chart!
That’s all there is for you to know about Heikin Ashi Candlestick Charts
THE HEIKIN ASHI FOREX TRADING SYSTEM
Timeframes: 30m and upwards
Forex Indicators: 9&18 Exponential moving averages (or you can use this combination of ema’s: 7ema & 14ema , 10 ema & 20ema or 10ema & 25ema
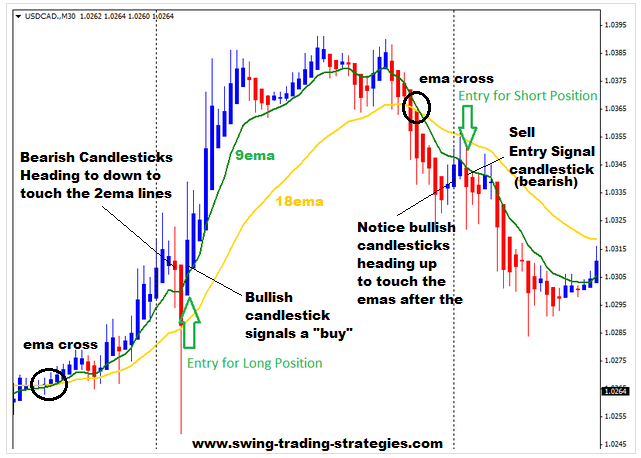
Buy Trading Rules:
- When 9ema crosses 18ema to the upside wait for the price to rally away from the ema lines.
- After a while, you will see bearish heikin ashi candlestick form and they will come down to touch the 9ema and 18ema lines.
- The buy signal entry candlestick is the first bullish heikin ashi candlestick that forms after those bearish candlesticks in step2.
- you can buy immediately at market order.
- place your stop loss below the low of the entry signal candlestick.
Sell Trading Rules
Its just the exact opposite for buying:
- when 9ema crosses 18ema to the downside, wait for price to fall down and completely away from the ema lines.
- after a while you will see bullish heikin ashi candlesticks form and will try to go back up to touch the ema lines. Once this happens, you know a sell trading signal may be just around the corner.
- The buy sell signal is given by the first bearish heikin ashi candlestick that forms after that those bullish candlesticks in step 2.
- sell at market order
- place your stop loss above the high of the entry signal candlesticks.
TAKE PROFIT TARGETS
- 3 times what you risked initially
- or look for a previous high or swing lows point using the the standard candlestick chart and place your profit target within them.
TRADE MANAGEMENT
The best trade management practice for extracting maximum pips out of a trendy move is to use those “tops” and “bottoms” to trail stop your trades.
……………………………………………………………………………………………………………………..
Open a live trading account and get up to $10,000 cash bonus. Click Here
……………………………………………………………………………………………………………………..
Here’s what I mean:
In a sell (short) trade, you want to place your trailing stop a few pips behind those consecutively decreasing tops as the price moves lower. Those tops are the price peaks that form as market moves lower.
In a buy (long) trade, you place your trailing a few pips below the bottoms as price continues to make its way higher.
Why do this?
Simple: so that you don’t get stopped out prematurely.
Note: you have to be using the standard candlestick chart and NOT the heikin ashsi to do this.
I hope you find this forex trading strategy useful or you can find other ways by using other forex indicators to combine with and create your own forex trading system.
 Posted in
Have a recommendation how to automate this beauty? Thanks
Hi Thomas,
You’d have to seek the services of MT4 programmers to help you out with that if you want to develop an EA, may cost anywhere from $50-$200 (my best guess) at freelancers.com
Hi ,
This is really great, could you let us know , what time can we take if we want to have the same strategy but below 30m Time Frame.
Hi Keren,
you can still trade whatever lower timeframes below 30min like 15min and 5mins…its really up to you.
Cheers
Mangi