


In this post we’ll pull back to cruising altitude to swing trade forex and take a look at some longer term charts. Let’s see what kind of swing trading opportunities we find.
EURUSD
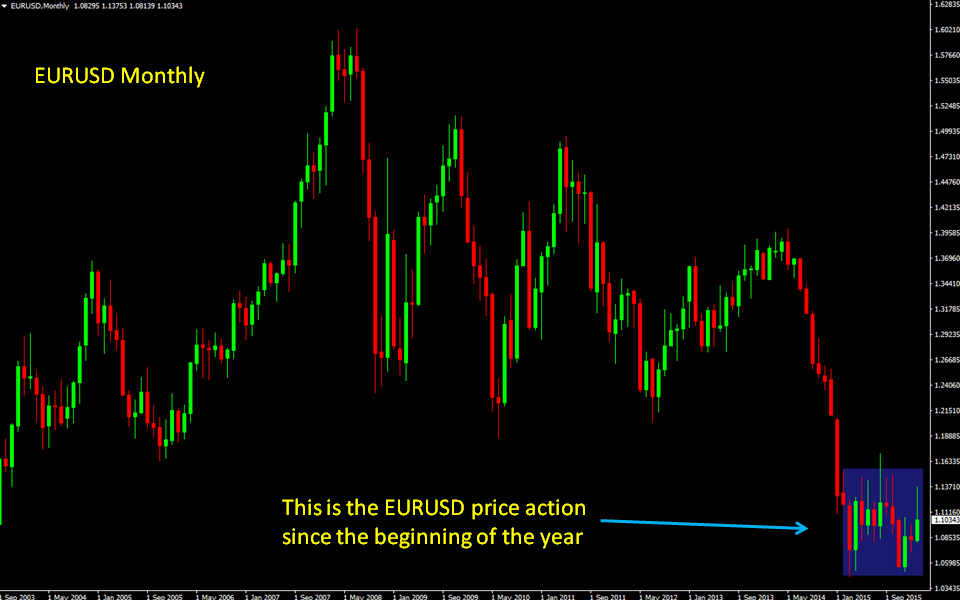
We recently took a look at the EURUSD and found an interesting triangle formation that we felt might give us a nice trade. That was indeed the case and as we saw in a follow up post it yielded up over 350 pips. To put this in perspective all of this price action took place in the relatively small highlighted area in the following monthly chart.
When we zoom in on this area, which goes back about a year, we see that price fluctuated between two very clear support/resistance zones. We did have that one brief excursion outside of the zone but it was quickly slapped back down. See the daily chart below.
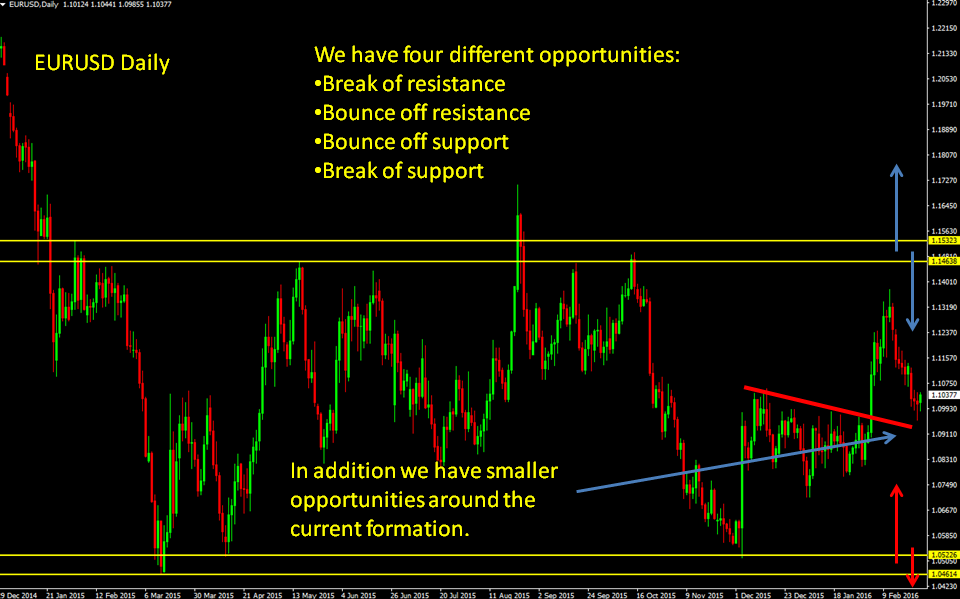
This gives us several setup opportunities:
- Go short on a bounce off the upper resistance zone.
- Go long on a confirmed break of the upper resistance zone.
- Go long on a bounce off the lower support zone.
- Go short on a confirmed break of the lower support zone.
Any of these scenarios can be traded from the daily chart but you could move to a lower timeframe like a one or four hour chart, to time your entries and exits. The risk in any of these is less than 80 pips while the reward could be over 800.
We have an additional opportunity at the current price level. We are entering a smaller consolidation area that goes back about six weeks. A break or bounce out of this could yield a push to the upper or lower support/resistance zone. This would obviously be a smaller and shorter swing trade. I suggest you move to an hourly chart for more precision on the setup.
EURJPY
We see another strong opportunity on the weekly EURJPY chart. Once again we have an area bounded by two support/resistance zones.
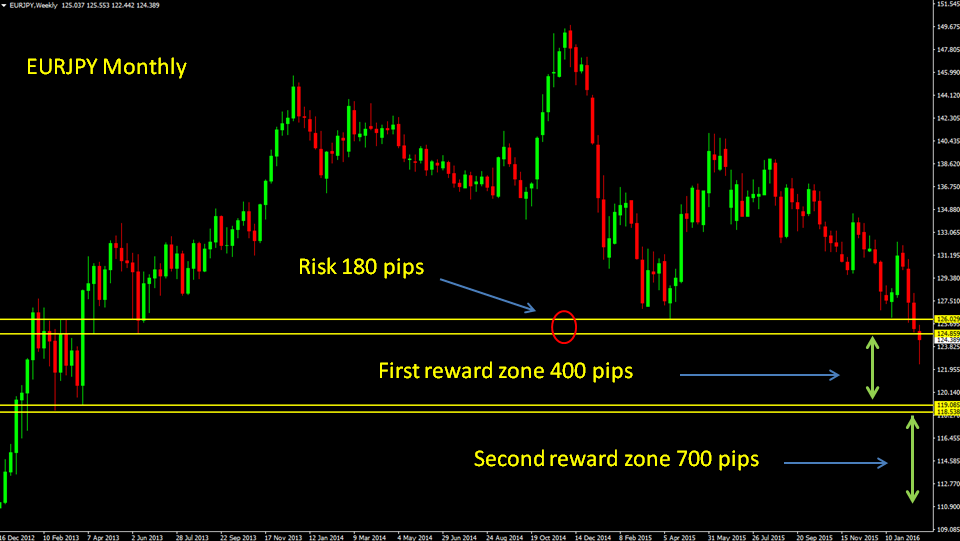
Price has already penetrated the upper zone and when you switch to a daily chart you’ll notice we have a good entry opportunity here. We have a risk of roughly 180 pips but the target of this trade is the lower support zone for a possible reward of more than 400 pips.
A better opportunity presents itself on a break of the lower support zone. The next support level is at 111.50 so that break would yield a reward of 700 pips. We’ll keep our eyes on this.
GBPUSD
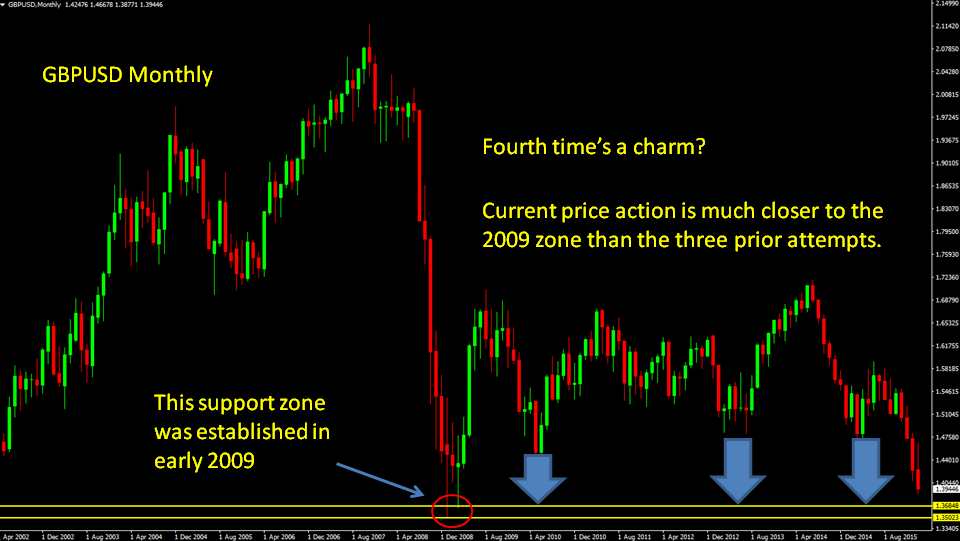
When we look at the monthly GBPUSD chart we see that we are approaching a support zone that was established seven years ago. As with the earlier charts to swing trade forex we’ll be looking to trade a bounce or a break of this zone. There had been a few failed attempts at the zone but none of them really got close yet the current move has already broken the levels of all of those attempts.
We’re now only 200 pips away from the zone so we’ll need to keep a watch on it. Bounce or break should be good for a couple of thousand pips if you have the patience to hold on. You can of course switch to a shorter time frame for some shorter duration trades.
AUDUSD
The AUDUSD has a promising swing trade forex formation. You’ll see from the monthly chart that we just broke a long term trend line and are now consolidating right below it.
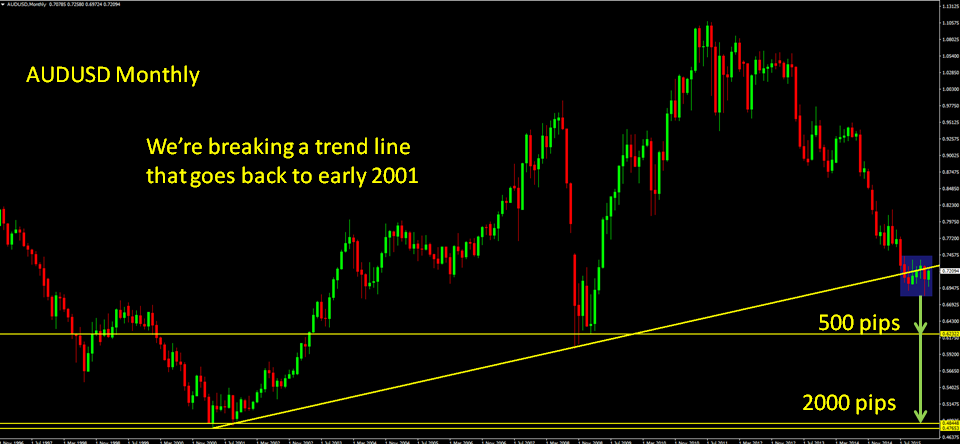
The big picture play here is to trade a break of the consolidation zone. We have support levels 500 and 2000 pips below the zone so the potential reward is significant, whereas the risk with such a break is only about 600 pips.
Obviously this gives us an unfavorable reward to risk ratio to the first support level but we can improve on that by switching to the daily chart.
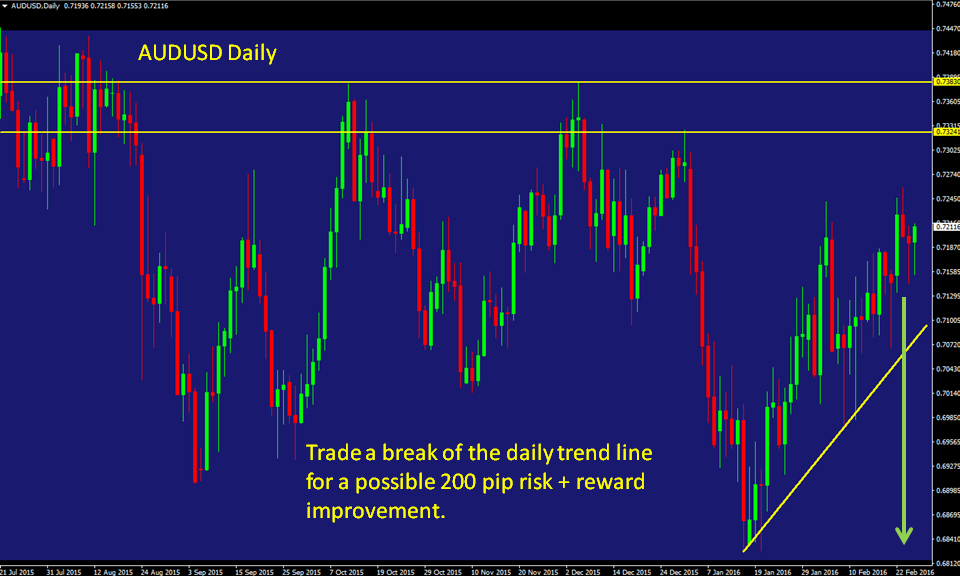
On this chart we see a much improved entry opportunity on a break of the daily trend line. This improves the potential reward on the trade by about 100 pips and reduces the risk by the same amount. You’d have to keep a watch on this trade as it nears the bottom of the congestion zone. To play it safe move your stop to breakeven once price gets close, just around 0.6900, and then wait for the break.
USDCAD
Finally we’ll consider the monthly USDCAD chart. We have a big opportunity on a break of 1.4300. We recently had a failed attempt at this but we look poised for a second attempt if we manage to bounce off the support zone around 1.3200.
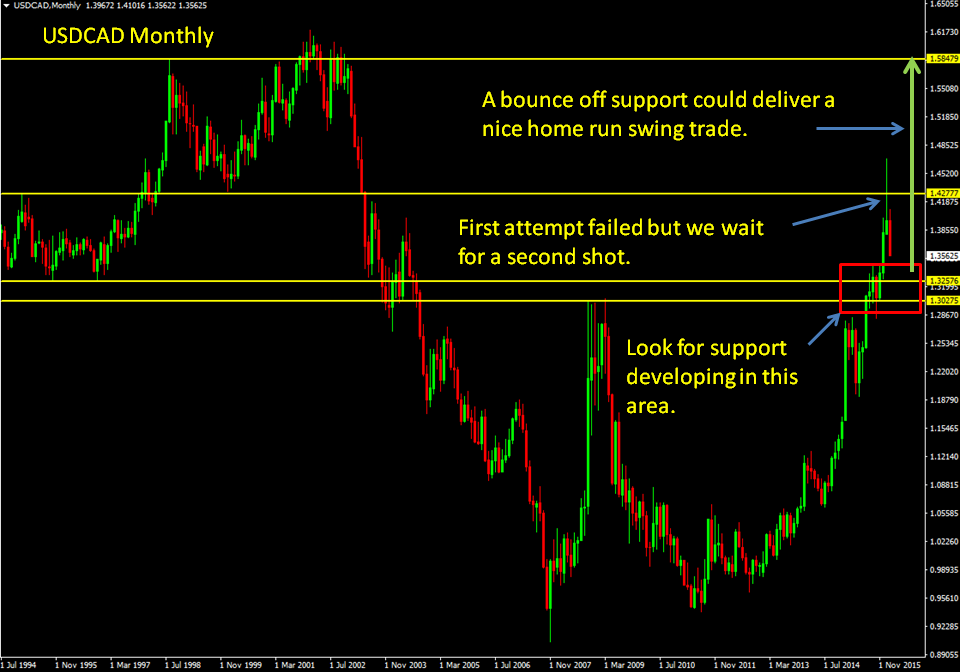
We’ll probably see price consolidate for a bit once it gets near support and when that happens we may redraw the support zone levels and switch to a daily chart to time our entry. The potential on this one however is significant, with convenient price levels at which we can scale out of a portion of our position. We’ll revisit this and the other charts a couple of months down the road.
You should consider using one of the many strategies on our home page when setting up individual entries and exits. This big picture analysis gives us an idea where we think significant price moves will take place but we should always use all of the tools available to us when executing the trades.
Stepping back and taking a bird’s eye (or jetliner) view of the markets will often point out possibilities that we miss when we’re in the trenches dragging ourselves through the minefields of the five and fifteen minute charts.
That does not mean that the faster time frames should be avoided. The same type of analysis can be applied to all time frames, but we recognize that the rewards, and risks, will be commensurately smaller and that the vulnerability to choppy, news driven price action will be greater.
Opportunities abound if you swing trade forex. Get in the habit of looking at the higher time frames. It will take just minutes to scan a large number of pairs but you’ll get a much clearer view than you would monitoring the minute by minute daily gyrations.
Good luck in your swing trade forex trading.
 Posted in