


The RSI trading indicator is a price momentum measure that also uses overbought and oversold zones to show when markets may be overextended. It makes up many trading methods and we are going to use it with our 5×5 RSI Trading System.
RSI = Relative Strength Index
The RSI, although referred to as “index” is not really an index so the name is a little misleading.
Just think of the RSI indicator as an oscillator that measures momentum over a set period (look back period) and will indicate when the momentum has pushed price to far in one direction (oversold/overbought).
Oversold And Overbought
Oversold is a term that is used when price is deemed to have fallen a certain distance away from the average price. This is a condition that is measured by the RSI dipping below level 30 on the indicator and is used in conjunction with a trading setup, usually a buy signal.
Overbought is the opposite of oversold.
When price has risen a distance from the average price, it can be deemed to be overbought and the RSI will be above the 70 level. Depending on the trading system, when the RSI is above the 70 level, the strength of price is considered to have been strong and a reversion is expected. This will set up a sell signal for most RSI trading systems.
What Does “5X5” Stand For?
Quite simply, it makes up the settings for the two trading indicators that will be used in the strategy:
- 5 period lookback setting for RSI – We will use levels 30,50,70.
- 5 period simple moving average (SMA)
Other initial details about the trading strategy:
Time Period – Any time frame can be used including short term for day trading or longer term charts for a swing trading approach with the 5X5 RSI trading system.
Currency Pairs – You can use any Forex pair you like however keep spread costs in mind if considering trading the exotic currencies.
How To Trade The 5X5 RSI Trading System – Forex Example
Here are a few notes before you get to the rules of the Forex trading system:
- the 5 SMA Indicator is for determining trend direction
- if the price is is above the 5 sma, it is deemed an uptrend or downtrend if price is below the 5sma.
- the RSI is used as a confirmation
Here is a sample buy signal
RSI TRADING SYSTEM – BUY SIGNAL SETUP
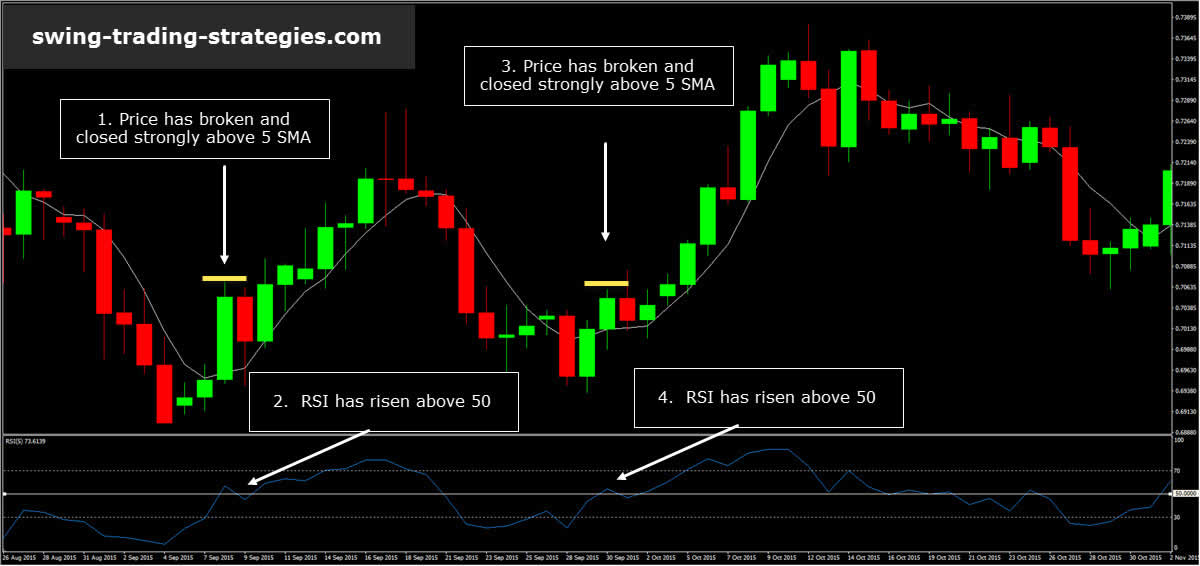
Buying Rules:
- Price closes above the 5 period SMA and is an obvious bullish candlestick
- RSI is above the 50 level. If this is the first cross over after a downtrend, that’s even better.
- Place a buy stop above the bull candle
- Place your stop loss about 5 pips below the low of the candlestick depending how your risk parameters.
- You can set profit targets, trail stop once price moves in your favor. Many ways to take profits.
The sell signal is opposite that of the buy set up just discussed.
RSI trading method short trades
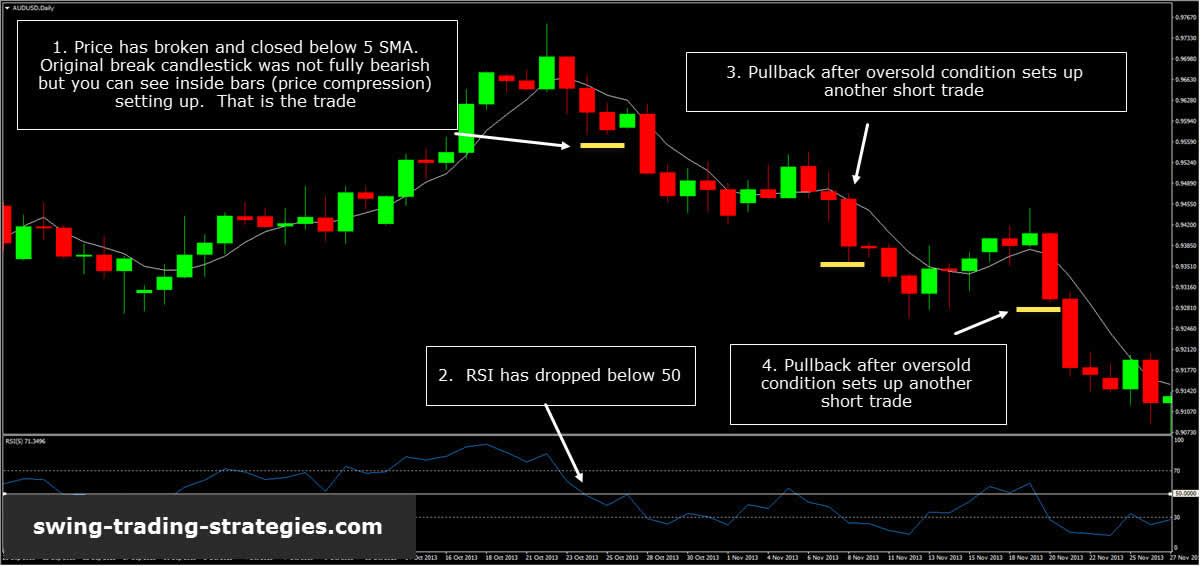
Sell Signal Rules:
- Price closes below the 5 period SMA and is an obvious bearish candlestick
- RSI is below the 50 level. If this is the first cross over after an uptrend, that’s even better.
- Place a sell stop below the bear candle
- Place your stop loss about 5 pips above the high of the candlestick depending how your risk parameters.
- You can set profit targets, trail stop once price moves in your favor. Many ways to take profits.
Using RSI To Trade – Important Points About This System
Remember that the RSI is a trading indicator, will lag price, and although objective, price action trading can help improve this system. Using price movement, especially how strong the candlestick closes, can bump up the edge you can have. You want to see strong closes or, as shown in the sell signal at #1, using price patterns such as inside bars and break from compression can help improve the system.
If you chose to take more trades after the original trend change trade, you may want to see that the RSI indicator has dipped into oversold or overbought territory. This often times will set up a pullback in the price that can aid in triggering another trade depending on how deep price moves.
Use stop orders for your entries as this will show that at least in the short term, momentum is in your favor.
There may be times that the candlestick that gives the buy or sell signal is quite large. Either reduce position size or wait until there is a pause or retrace in price.
There will be times that the RSI flips back and forth over the 50 line. This indicates choppy price action and you may want to highlight that price action with lines to show a pattern break.
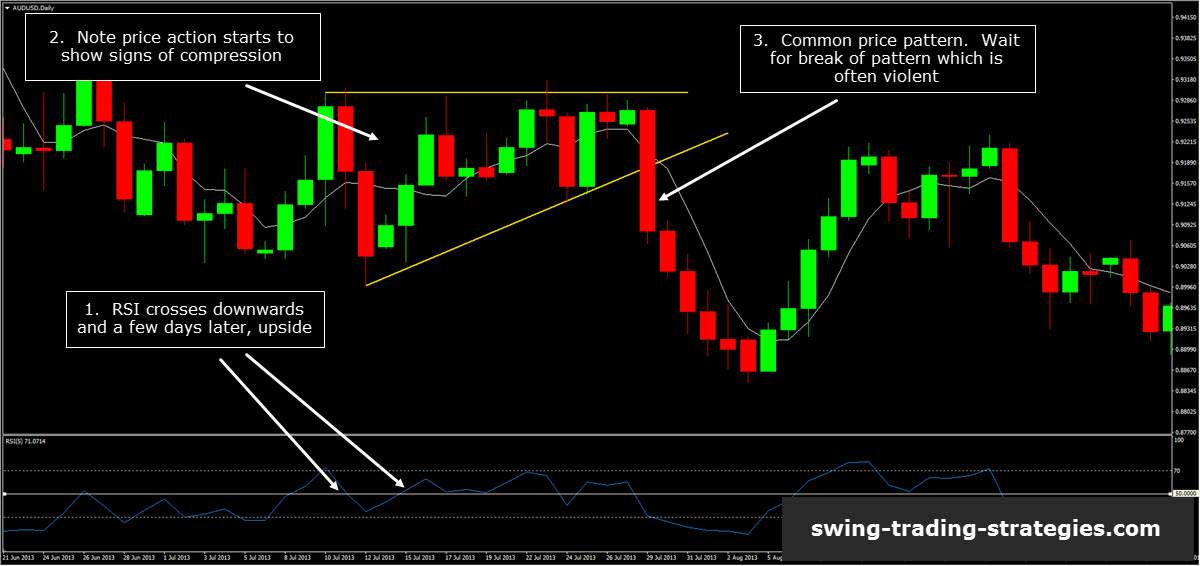
RSI AND CHOPPY PRICE ACTION
Regardless of the time period you trade, you will run into issues such as price action that indicates chop. You do not want to implement this strategy during those times. Use standard price patterns to contain price movement and wait for the break of the price pattern to occur.
Once the break occurs, return back to the rules for the RSI trading system.
 Posted in