


I don’t toss the words “best trend trading strategy” around lightly because best is in the eye of the beholder.
Many trend trading strategies have the potential to change the way you trade and have the potential to increase your Forex trading account quickly – with proper money and risk management of course.
What you will be doing with this trend trading strategy is determining the trend and entering multiple trades in the direction of that prevailing trend.
Before you start reading, can you commit to: hanging on and don’t bail out too quickly and take your little profits and run when the trend has not ended yet!
I will show you a simple trading method to help you hang on but you must commit to letting these trades play out!
This is one of the best trend trading strategy that really simple and you can use it in all time frames and even use it as a Forex scalping system.
4 Step Trend Trading Method
Here’s the secret to this trend trading strategy:
“Wait for Pullbacks And Then Enter A Trade On Each Pullback In The Direction Of The Trend”
To do this, you will need to know the following four steps:
- How to determine the direction of the markets trend
- Know what a pullback is and how to spot a pullback happening
- What the buy or sell signal is that you should look for
- How to exit the trade.
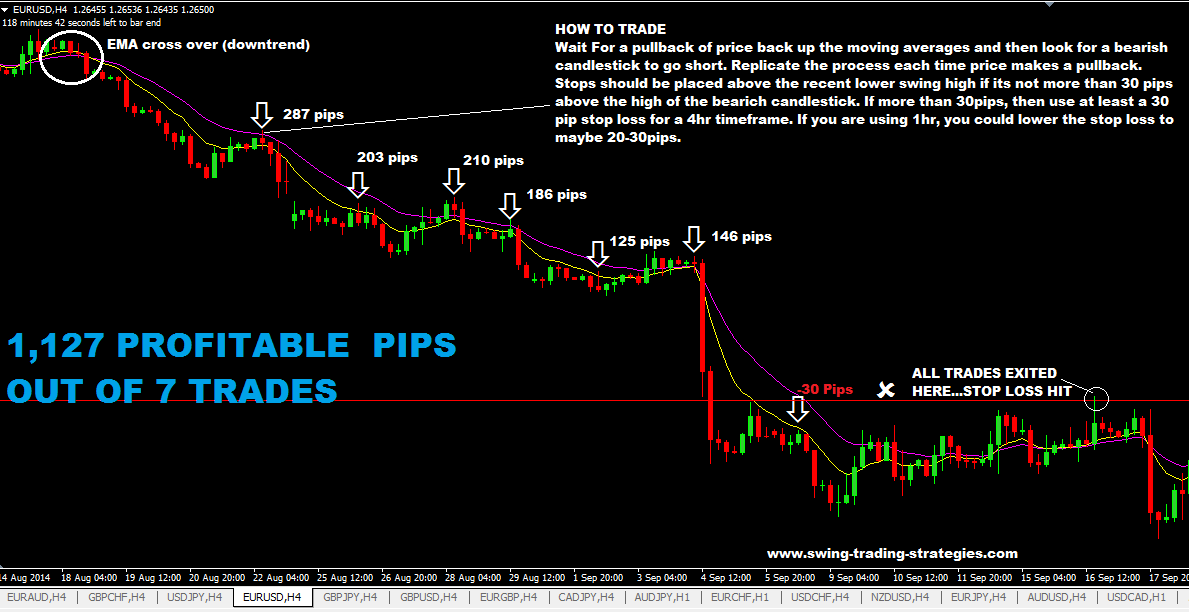
Refer to this chart and examples of trades for the detailed explanations that will be given below. You need to read them.
STEP 1: HOW TO DETERMINE TREND DIRECTION
This is fairly easy and many traders have their own techniques. You need two moving averages to crossover and that signals and determines the trend direction. The type of moving averages you use does not really matter. It can be an SMA (simple moving average) or it can be and exponential moving average (EMA). You just need two of each to make this work.
Use the following moving averages combination can be used:
- 9 ema & 18 ema (or they can be SMA – there is no magic in them)
- 7 ema & 14 ema
- 25 ema and 50 ema
The smaller moving average is the faster one and the larger moving average is the slower one. So when (for example) the 9 ema crosses the 18 ema and goes down, you should know that its a downtrend signals.
If 9 ema crosses 18 ema and goes above it, its an uptrend signal.
STEP 2: WHAT IS A PULLBACK AND HOW TO SPOT ONE?
This is a simple definition of a price pullback : a pullback is when price after moving away from the two moving averages for some time eventually comes back to it
When price comes back to it, it is anticipated that those two moving averages will act as resistance (if this was a downtrend) or support if this was an uptrend so when price hits them, it will bounce away from them in the direction of the trend.
Here’s another way to define pullback:
a pullback is a minor/temporary trend in opposite to the main trend.
This means if the main trend is downward, then even during this downward trend, price will make minor rallies upward only to get pushed back down to continue in the main (original) downward trend.
How do you spot a pullback?
- Two moving averages cross and price moves completely away from them for some time.
- You start to see a pullback happening when price starts coming back to the two moving average lines and eventually touches them.
Keep in mind that moving averages don’t really act as support and resistance. We use them as a reference point to frame the price on the chart in a manner that we can understand.
This of moving averages for this trend trading strategy as a landmark – a place you look for direction.
STEP 3: WHAT IS THE SELL OR BUY SIGNAL TO LOOK FOR?
This is also so simple: you look for price action signals.
By that I mean:
- if the trend is down and price makes a pullback to to the moving averages and touches them then you look for bearish reversal candlestick patterns.
- if the trend is up and price makes a pullback then you look for bullish reversal candlestick patterns.
Click this link for 10 powerful reversal candlestick patterns.
STEP 4: HOW TO EXIT A TRADE
The most important part of this strategy is how to exit. Remember…you are entering multiple trades in the prevailing trend direction.
So what that means is at the most you may have anything from 3-10 active trades running! How are you going to manage the placement of stop loss for each of these trades?
Let me give an example of a short trade in a downtrend market:
- in your first trade will be on the first pullback after the moving average cross over. Your stop loss should be placed just above the recent lower swing high (peak) if its not more than 30 pips away. If no nearby lower swing high is there, then place stop loss at 30 pips from the high of the bearish reversal candlestick pattern.
- your second trade will be taken on the 2nd pullback and use the same strategy as above for your stop loss placement.
Now here’s the critical thing: move the stop loss of the first trade down to where you placed the stop loss of the 2nd trade. This means that if your first trade is in profit, moving its stop loss down to the stop loss level of the 2nd trade either makes your first trade break even, or it would have some profits locked or its stop loss distance is reduced thus reducing the risk on that first trade.
What this means is that you are not increasing your risk by taking the 2nd trade because you’ve already moved the stop loss of the first trade…Understand now? Good!
- your third trade will be taken on the 3rd pullback. Now use the same techniques as above for stop loss placement on this 3rd trade. Now you will have to move the stop losses for the first trade and the second trade down and place them in the level where the stop loss for trade 3 was placed.
This means if trade 3 was taken way below trade 2 then that means trade 2 would be profitable including trade 1. So moving trade 1 and 2 stop losses means that you you have locked in profits for trade 1 and 2 and if trade 3 goes profitable, you will continue to repeat the process for each subsequent pullbacks that happen.
- So eventually all your trades will get stopped out.
You can see why risk management is so important.
BUY SETUP RULES
What I’ve described above is for a short trade (downtrend) situation. You just do the opposite for an uptrend situation:
- moving average crossover to the upside indicates uptrend.
- price breaks away completely from the moving averages and shoots away-upwards.
- eventually it comes back down to touch the moving average lines (it can only touch one or touch both…it does not really matter, as long as price touches at least one).
- the first pullback is your first buy trade setup and you should watch for a bullish reversal candlestick to enter a long trade. Best option is to place a buy stop order 2-3 pips above the high of that bullish candlestick anticipating a breakout of the high.
- place stop below the nearest higher swing low if its not more than 30 pips away from the low of the bullish candlestick. If its more, just use a 30 pips stop loss. This 30 pip stop loss is preferred for a 4hr chart.
- at each pullback, you continue to place more trades, adding to your already existing open positions.
No holy grail but rides the trend. Forex trends can often run for months or even years
- every time you enter a new trade, your risk is on that one single trade is the average the risk of only one trade…even though you may have 10 open trades. For example, you have opened a 10th trade on the 10th pullback, and you have moved all your stop losses for the previous 9 open trades down to the stop loss level of the 10th trade you just place.
This means that there’s absolutely no risk at all on previous 9 trades except the 10 trade you just place. So your trading risk is just for one trade. All the 9 trades you have are all in profit! How good is that?
- in a solid trending market, this trend trading strategy will honestly bag you hundreds to thousands of pips very easily with only one trendy move!
- Best Time frames to use are the 1hr and the 4hr chart. This is where the most money is made. There is so much “noise” in the smaller timeframe charts.
- The risk to reward of this trend trading strategy is really good. Every trade you enter has the potential to earn your more than 3 times what you risked initially.
- you do not restrict your profits by using a “take profit” target level in your trade…what you are doing is riding the trend most of the way up or down and allowing the market to take you out.
This is a faster way to increase profits and therefore increase your trading account fast because you are not limiting your profits but allowing them to run and adding more positions along the way with very little risk to each new trade that you place.
How Be Trend Trade Successfully
I said in order for you to be successful with this amazing strategy is not to bail out to soon and take your small profits and run. I promised you that I would give you simple effective technique to help you avoid doing that and here it is:
- when you see a trade, place it and let the market do its job and get away from your computer.
If you are have taken a trade based on a 4 hr chart and you are sitting down there in front of your computer, what are you going to achieve?
Nothing!
If you sit there, you start to see those little price fluctuations and start to see your floating losses and you may exit too early only to realize that as soon as you exit with a loss, price moves in the direction of your trade or you see a nice floating profit and then you see that price is heading in the oposite direction and starts to eat the profits and you can’t stand it anymore so you close out your trade with a little profit…thinking you’ve made the right choice only to realize an hour later that the market has moved massively on the original direction of the trade.
We are not day trading!
So best option?
You know the risk that you will take on a trade, place that trade and walk away! If the stop loss gets hit so what? That’s was what the risk you were willing to take so what? Or if the floating profits start to get smaller so what?
You stop loss is not yet hit…the market can turn and go in the direction of your trade…
CONCLUSION
I’m must admit, I’m not a real fan of trading with moving averages and don’t use moving averages as part of my trading strategy because I trade 100% price action.
But if you are one of those Forex traders that like trading moving averages, then let me tell you that this trading strategy has great potential. In my opinion, the real secret to taking high probability trades with such a trend trading system is by using reversal candlestick patterns. This will allow you to get into a trade at just about the right time before the market moves the other way.
Can I ask you for just 10 seconds of your time? I would appreciate you can click any one of the buttons below to tweet, share, G+ facebook like/share etc? Advance Thanks for doing that. I hoped you’ve enjoyed reading about this forex trading technique that can increase your trading account fast 🙂

By the way, you may also be interested in reading these:
- price action trading secrets & tricks
- forex trading strategies that work
- best trading trading strategy for capturing insane amounts of pips.
- top 10 candlestick patterns
- you want to survive forex trading, you need to read forex trading risk management techniques.
 Posted in
Hello i absolutely love your website. I have used one of your basic Forex strategies the 200 EMA one which has been very profitable.I would like to start using this one because it looks like it could give me better returns on my risk but after reading this and going over the charts im still not a hundred percent sure how to fully get the best out of this strategy.
I would extremely thankful if you could redo this article or just tell me how i can get better entries using this and etc..
Carlos,
good to hear about your success using the 200ema strategy.
In my experience, price action is the way to go if you want better entries.
Cheers
Mangi Madang
Have you ever personally used this system and would you recommend it
Hi Kevin,
I’ve used this system in the past with good results, so in terms of recommending it, yes, I’d say go for it.
I am no longer using it anymore as I am now using only price action trading. The reason why I left it? My trading personality is not suited to this method.
Cheers
Mangi Madang
Thanks for the response,i must agree that price action methods are the best from what i have seen and experienced. One last question , don’t mean to bother you , is there anything that you would recommend to improve this system and what markets does it performs best in e.g equity index’s commodities or currency pairs.
Thank you
Kevin Sanger
Hi Kevin,
there are couple of ideas I have in my mind that I think could make this a better system. These are ideas only that need to be tested and should not be taken as recommendations. (If I knew how to code trading systems, that would be so awesome to verify if my ideas are good or bad…anyway,this is not about that).
(1) Personally, I’d stick with forex market due to the huge liquidity of the fx market as well that fact that it opens for 24hrs a day. I never have traded commodities and have very little trading exposure to the equities market so I cant say anything on that.
(2) ideas to improve the system? These are the few I have in mind:
-use price action for entry confirmation
-work this system in conjunction with support and resistance levels/fib levels.
-you should also know the structure of how trends form/trends end and use that knowledge in conjunction with this trading system.
-chose only a few currency pairs that have good trending characteristics and use this system on them.
-try trading only certain trading sessions (maybe London & US trading session only) and avoid trading on the Asian trading session
-timeframes? What timeframes are the best to trade? 1hr, 4hr or daily? I’d say go with the 1hr & 4hr but its really up the you what timeframe you want to use.
Regards