


Japanese candlestick charts originated in Japan in the 18th century where buyers and sellers in the rice markets used them to exchange a form of currency for the rice.
We’ve come a long way, with the help of Charles Dow, since the days of rice trading and Japanese candlestick patterns are used by many swing traders, day traders, as well as in markets from Forex to the Stock market.
This is pure price action trading and it has really become a lost art. Many traders use too many indicators which hides price action and has you trading an indicator and not the first level – price and the patterns that it forms based on the strength of weakness of market participants.
Why use candlestick charts?
Japanese candlesticks contain a lot of information in just one candlestick. For example, by scanning your candlestick chart, you can easily see where the high and lows of the day were as well as the open and close price of the trading day. If price closed higher than the open, it was a bullish trading day and the candlestick, the real body of the candlestick, would close green. This is called a bullish candle.
On a bearish trading day, the real body of the candlestick would close red indicating a bearish candle.
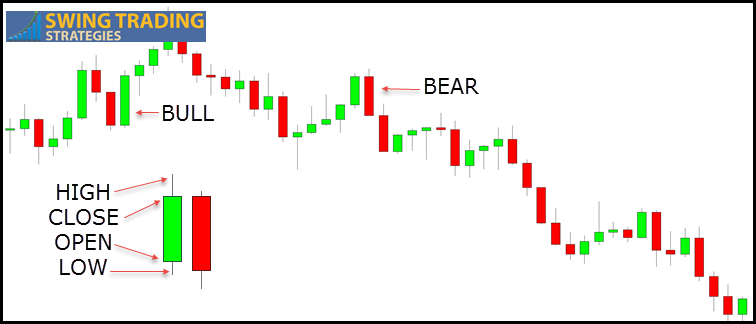
JAPANESE CANDLESTICK CHART
You can see at a glance who had control going into the close just by looking at the color of the candlestick. You can also see, through the highs and lows, how much of a battle the other side put up during the trading day. This will give you insight into the strength of the overall winner on the trading day.
There are many candlestick patterns that you can use for Forex and Stock swing trading but you don’t really need to know all of them unless you really want to confuse yourself. Yes, there are that many.
What you need is to study and know only the most reliable candlestick patterns and become a master at trading with them.
Best Bullish Candlestick Patterns
There are a few times you can use a bullish Japanese candlestick patterns that you may want to consider as part of a swing trading strategy in the context of a bearish trend:
- If the Forex market is trading inside of a range, look for bullish reversal candlestick patterns at the support side of the range.
- If the market you are trading is in the corrective swing of an overall down trend, look for a bullish reversal at an area of support.
- If the market is in a down trend and puts in price exhaustion, look for a potential reversal of trend using bullish candlestick patterns.
- If the market is in a trading range and is consolidating under resistance, look for bullish price patterns to aid in positioning before the breakout.
The 5 reliable bullish reversal candlestick patterns are :
- Bullish Engulfing
- Hammer(the colour can be both green or red, it does not really matter)
- Bearish Hammer(some traders call it the pregnant candlestick pattern…it is obvious why 🙂 )
- Piercing
- Doji
Continue to read below for the description of each of the bullish candlesticks above and also find out how each candlestick pattern is formed and how this information can help you trade successfully with candlesticks.

Bullish Candlestick Pattern
Bullish Engulfing Candlestick Pattern
The bullish engulfing candlestick pattern consists of 2 candles. The first candle is a narrow range candle closes red. What this means is that there are lot more sellers than the buyers but because it is such a narrow range candle, it also tells you that the sellers are not that aggressive.
The second candle is a bullish wide range candle that engulfs the real body of the first candlestick and closes near the top of the range. What this means for this second candle is that that the market forces have changed:they buyers have overcome the sellers and have taken control of this currency pair.
If you see a bullish engulfing candlestick pattern in a level of support, fibs or pivots, then these can provide a powerful reversal!
Bullish Hammer Candlestick Pattern
The bullish hammer is a single candlestick pattern. Note that, this candle can be either red or green. This is how the candle forms: when the currency pair opened, at some point, the sellers took control of the currency pair and pushed it lower. However, the buyers started buying and pushing back price up and it closes higher than it opened or a bit lower than its opening. The long lower shadow is vital. The longer, the better. Check out the Fakey Trading Strategy for more on this type of candlestick.
Bullish Harami Candlestick Pattern
The bullish harami (inside bar trading) is a 2 candle pattern. The first candle is is a red candle, which would have a wide range. The second candle would be a green narrow range candle.
What this this tell you about the forces in the market?
When you see the bullish harami candlestick pattern, it simply tells you that the downward or (bearish) momentum has stopped or slowed. Why? Because on the first candle, the sellers were seriously in control. Then on the 2nd candle, a bullish candle, the buyers managed to defeat the sellers and at least got the candle in green.
Bullish Piercing Candlestick Pattern
The piercing pattern is a two candle reversal pattern. The firs candlestick is a red one followed by a green candlestick. Both candlesticks are roughly equal and of the same wide range.
What does this mean?
It means that in the first candle, the sellers were really in control. When the next candle forms, instead of going down, the opposite happens, it goes up.
The candlestick is green!
This means the the buyers (or you can also say the bulls!) came in with such ferocity and pushed the candlestick price to close more than (or at least) halfway up the range of the previous red candlestick.
Bullish Doji Candlestick Pattern
Doji is without doubt, the most popular candlestick pattern. This is what happens in a doji candle: the candle open up and goes pretty much nowhere and closes at or near to its opening price. The doji candlestick can both be green or red.
What does this mean then?
It means that the market forces of buyers and sellers are undecided. It shows a period of indecision by traders questioning the current trend. And if the current trend was bearish, the formation of a doji candle could signal that the bears are having second thoughts and an uptrend in price could result.
Best Bearish Candlestick Patterns
There are a few times you can use bearish candlestick patterns that you may want to consider as part of a swing trading strategy and in the context of a bullish trend.:
- Bearish Engulfing
- Shooting Star (the exact opposite of Bullish Hammer…as usual, the color of this candlestick can be also green)
- Bearish Harami(looks like a pregnant woman…the big green candlestick is the mother candle and the little red inside bar(candlestick) is the baby candle)
- Dark Cloud Cover
- Doji

Bearish Candlestick Patterns
What you will notice with the bearish candlestick patterns is that they are completely opposite of the bullish candlestick patterns given above.
- If the Forex market is trading inside of a range, look for bearish reversal candlestick patterns at the resistance side of the range.
- If the market you are trading is in the corrective swing of an overall up trend, look for a bear reversal at an area of resistance.
- If the market is in an up trend and puts in price exhaustion, look for a potential reversal of trend using bearish candlestick patterns.
- If the market is in a trading range and is consolidating over support, look for bearish reversal price patterns to aid in positioning before the breakout.
Bearish Engulfing Candlestick Pattern
The bearish engulfing candlestick pattern is just the complete opposite of bullish engulfing pattern. What happens is that the market is in an upward rally (uptrend) then the first green candlestick forms. This candlestick is a narrow range candlestick. Then the 2nd red candlestick forms which has a wide range and its “shadow” completely engulfs the first candlesticks.
What does it mean?
The fact that the first candle had a short range meant that the bulls may be possibly losing the upward steam. The further confirmation to this was the formation of the 2nd red candlestick.
Bearish Shooting Star Candlestick Pattern
This is generally a red candle that looks like a shooting star: a short head and a long tail. Note that it can both be red or green. The shooting star is the opposite of bullish hammer. The key point here is that the shooting star candlestick has to form during an uptrend. The shooting star candlestick is characterized by a very long tail and a narrow head.
This is what happens in a shooting star candlestick: buyers took over initially pushing the price all the way up, but then the sellers came in with such force and pushed the price all the way down ensuring that it close way below its opening price. When this candlestick forms, you always should know that the sellers are dominant.
Note also that the shooting star candlestick can be both red(bearish) or green (bullish) but it has to form in an uptrend market.
Bearish Dark Cloud Cover Candlestick Pattern
The dark cloud cover candlestick pattern is a 2 candle pattern. The first is a green green candle with a wide range and then followed by a red candle also with a range somewhat similar to the first rand candlestick. The 2nd candlestick should close at least halfway point down in comparison to the first green candle.
This is what happens in a dark cloud cover candle: the buyers came in strongly on the first candle, pushing price strongly up. The second red candlestick generally would have opened higher and gone up a bit but then the sellers came in with such force and pushed price all the way down to halfway point or more of the 1st green candlestick.
This tells you that the the sellers are in control. It may also mean that the buyers may have realized that they are on the wrong side of the market and closed their buy positions and taking profits and may have started selling as well pushing the price down.
Bearish Doji Candlestick Pattern
The bearish doji candlestick pattern is a single candlestick pattern that you should be looking for during an uptrend market. With doji’s the opening and the closing price are equal or so close that they really don’t have a body at all. They almost look like a cross.
Doji’s are one of the simplest candlestick patterns to identify. The color of the bearish doji candlestick pattern can be both red or green but it is important that it forms in an uptrend market.
Benefits Of Using Japanese Candlestick Charts In Forex or Other Markets
If you use a trading indicator, you are using a derivative of price; meaning the price happens first and the calculation of the indicator uses that price to plot the indicator on your chart.
Using candlestick patterns, you are using pure price action to assess the market. There is no lag in price and you are seeing the exact behavior of all market participants during the trading day all in one candlestick. You see where price opened, how far the bulls or bears pushed price and the winner of the trading session.
If you can draw support and resistance zones, you have the makings of a swing trading strategy. Put in your understanding of candlestick patterns and you can look for reversals using these patterns at significant points on the chart.
The Problem With Candlestick Price Patterns
The biggest problem is not the pattern but traders who search for these patterns any place on the chart. As price action moves in waves, there will be patterns in locations that don’t truly have a meaning. This can cause newbies to start taking trades all over the chart.
Tip: Wait until these price patterns show up at significant zones on the chart.
Another issue is you don’t know how the battle during the day played out.
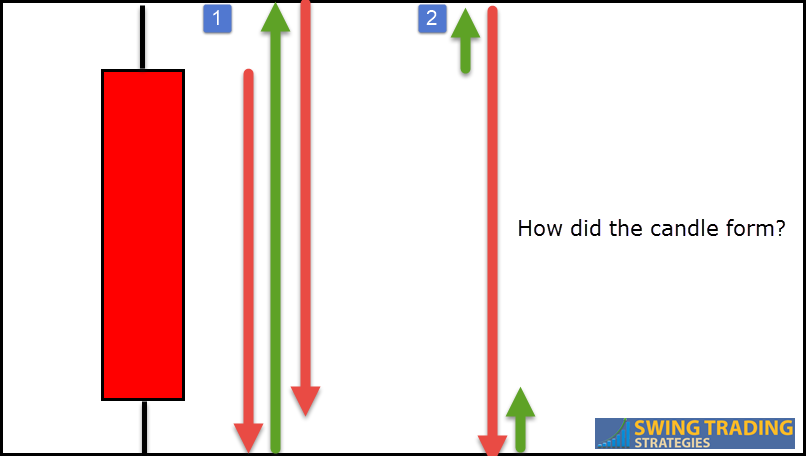
CANDLESTICK FORMATION
This is clearly a bearish candle but how it formed can be important information. Unless you drop down to a lower time frame, you won’t know how one sided the trading battle was that day.
- Bears came in strong but the bulls rallied price back up to take out the opening price. The day finally closed with the bears gaining strength.
- Bulls stepped in off the open and rallied price. Bears were too strong that day and took away the bulls momentum dropping price to the lows. Small bull strength at the end of the day could not erase the bears strength.
Is that important information?
You bet it is.
It is possible that in #1, the bulls take another run north and squeeze all the short players.
One more thing, I would look for these candlestick patterns on higher time frame charts where they will be more reliable than in the churning price action of day trading…especially in Forex.
ARE ALL REVERSAL CANDLESTICK PATTERNS ACCURATE?
Like all things in Forex trading, nothing is 100% accurate. The reason reversal candlesticks are useful is that certain behavior in the Forex market price produces certain candlestick patterns. Now, if you go and do a historical analysis of these candlesticks, you tend to see a picture regarding these candlesticks.
You tend to see things like: “When this candlestick formed at this level(maybe support or resistance level), price rose dramatically, or price fell”.
So then what happens is that you start to get a picture and feel of what to expect every time you see such a candlestick pattern forming. This is where reversal candlesticks other candlestick patterns become useful to Forex swing traders.
FOREX TRADING STRATEGIES AND CANDLESTICK PATTERNS
You can use these candlesticks in most Forex trading strategies . You just have to find a Forex swing trading strategy and try to incorporate these candlestick trading techniques into your trading.
I am of the opinion that you should not trade candlesticks all alone by themselves. You need to trade them in conjunction with support and resistance levels, Fibonacci levels etc, as indicated above.
There may be some instances where a Forex trading strategy is based entirely on one candlestick and such a case would be like the inside bar trading forex trading strategy here.
Common Candlestick Pattern Questions.
SHOULD THERE BE ANY GAPS ON BULLISH ENGULFING AND BEARISH ENGULFING PATTERNS, PIERCING LINE?
In Forex, the market is so liquid that from my observations, there’s hardly ever any gaps if you observe from larger time frames like daily, 4 hr etc. Maybe on Monday’s when the Forex market opens, and in smaller time frames like the 1 minute up 1 hr charts you may see some gaps happening.
For me, as long as the 1st candlesticks is OVERSHADOWED by the 2nd candlestick that is good enough for me. See chart below for example…
FOR EXAMPLE, ON A BULLISH ENGULFING OR PIERCING PATTERN, DOES THE 2ND CANDLESTICK NEED TO OPEN BELOW THE CLOSE OF THE BEARISH CANDLESTICK?
Not necessarily…
- it can open on the same level
- or it can have a tail stick downward after opening (see bullish engulfing pattern example on the chart below with a little bit of tail sticking out on the bottom)
- The important thing you need to ask yourself is this question: does the candlestick overshadow the 1st candlestick?
- You’d also like at least to have a candlestick with a much longer body showing a really strong bullish momentum on the 2nd candlestick.
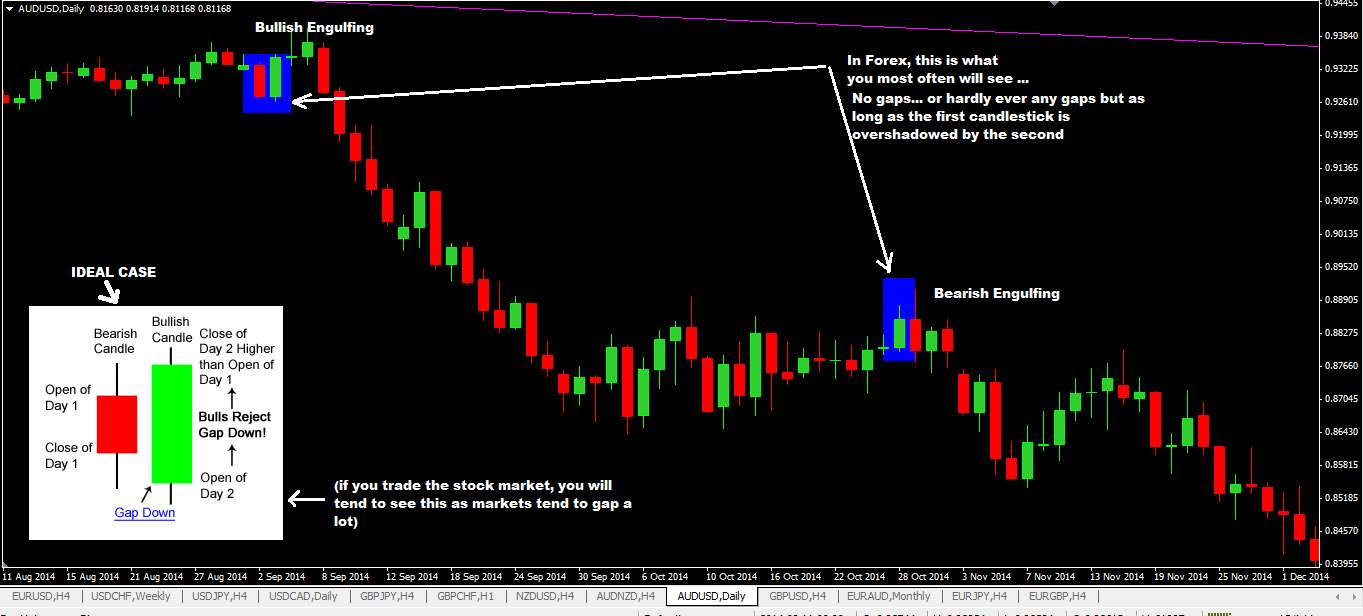
In the stock market, its a different story and I think you will see a lot of gaps on patterns like bullish and bearish engulfing.
– Updated from 2015
 Posted in
Hi Mangi,
Thank you for providing this post and your site. I have found them helpful in trying to learn a new and successful forex trading strategy. I have a question about some of these reversal candlestick patterns. On certain patterns such as bullish or bearish engulfing, piercing line and dark cloud cover, I am wondering about whether or not there needs to be a gap between the close of the first candlestick and the open of the second one.
For example, on a bullish engulfing or piercing line, does the second/bullish candlestick need to open below the close of the bearish candlestick? Or is it still a strong and reliable reversal candlestick pattern if the second bullish candlestick opens at the same spot where the first bearish candlestick closed (ie. no gap), as long as the second candlestick appropriately engulfs or pierces?
Any information provided would be greatly appreciated.
Regards,
Andrew
Hello Andrew,
I’ve written an update on the post above with answers to your questions.
Hope this helps.
Thanks
Mangi
Hi Mangi,
Thank you very much for your response. That does answer my questions. The reason I asked is because just last week I did my first few trades in a demo account based on bullish engulfing and piercing line, and there were no gaps between the bearish close and bullish open. The first two trades profited and I closed them. The third one is down right now but I am holding it to see if it goes up next week.
Another question, do you still recommend the following strategy (link below), of looking for the types of reversal candlestick patterns mentioned in this post combined with bollinger bands touching the top/bottom band and stochastic above 80/below 20? This is the strategy I have used for the first few trades I mentioned above.
http://swing-trading-strategies.com/bollinger-band-swing-trading-system/
Just wondered if you had any thoughts or additional comments on trading with this type of strategy on daily charts.
Thanks again for your assistance,
Andrew
Andrew,
this strategy http://swing-trading-strategies.com/bollinger-band-swing-trading-system/ can be used with reversal candlesticks mentioned here.
Cheers
Mangi