


Trading Price Action Reversals is pure price action analysis that can be used in any time frame including the daily chart.
It may seem easy for those that have been in the Forex trading business for a long time but for a beginner Forex trader just starting out, it may not be easy at all.
Why?
Trading price action reversals can be very subjective unlike trading with indicators which will show you the information depending on the indicator settings. It’s no different than other technical analysis that uses price action and trading structure.
Traders will see look at the same price chart and there could be many different opinions of what is being seen.
Regardless of the method of trading, there is hardly a successful trader that does not use some type of price action analysis in making their trading decisions.
Let’s take a step by step look at trading price action reversals and we are going to narrow it down into 2 general steps.
2 Simple Steps To Trading Price Action Reversals
As mentioned, we are going to distill the entire process down into two general steps. Inside of those steps, you must expand on each of them to get the full power of price action trading.
- Identify Areas of Support and Resistance Levels, Pivots, Fibonacci levels etc…that price will have a greater chance of reversing from once price hits that level.
- Use Price Action To Enter Trades
Not the trading insight you were looking for? Most things in trading that are successful are actually quite simple. Traders however think that complex equals profits and that is not the case.
The key is step number one; identify areas (inflection points) where we can expect some type of resolution to market direction, either up, down, or sideways.
1. Identify Support/Resistance Zones, Pivots, Fibonacci Levels
Have you ever seen price do a massive reversal and wonder why it changed its direction? Chances are very good that price entered a support or resistance zone, generally from a higher time frame chart such as the daily or weekly chart. At that point at the chart, a decision must be made and remember, price leaves clues.
There will be a tip off as to who is going to take over the market.
If a trend reversal is taking place (depending on time frame) either the buyers or sellers have to forfeit their hold on the market. Price action, which we will cover in a moment, will show you who owns the balance of power.
Price could also be coming into moving averages (although they don’t physically support or resist price), Fibonacci levels, or a confluence of technical variables.
How do you identify areas of support and resistance levels in your chart?
Well here’s a good explanation (click that link) of how to identify support and resistance levels on your Forex chart.
Spend a lot more time looking at your charts and see how price has reacted and reversed in the past and understand why it does so. Nother beats finding your own “aha” moments as you discover the clues price action leaves as reversals take place at these levels.
2. Use Price Action To Enter The Trade
Now, once you’ve identified a certain resistance level or maybe a support level…what do you do? Wait and watch and see what price will do? Will it come to that level or not?
And when it comes to that level, what would you use as a confirmation signal to enter you trades?
Answer: a reversal pattern!
Remember, if price is heading to a resistance level, you are looking for a bearish reversal candlestick pattern to sell (or go short).
If price is heading down to a support level, then should be looking for a bullish reversal candlestick pattern to buy (or go long).
We want to see a price action setup that leads to a reversal in order to get involved in pullbacks, larger trend changes, and even be able to trade better inside of a trading range.
What reversal candlesticks would you use? I strongly suggest you use this: best reversal candlestick patterns (make sure you read and memorize those reversal candlesticks and ensure you test their validity!) Some of my favorites include a pin bar reversal candlestick and shooting stars. I also love “springs” and “upthrusts”.
Before I show you some examples, let’s be clear on something; when trading intraday, allow a wide margin of error when it comes to reversals in price. You may think you are trading either a pullback or a larger trend change but unless you look as something like a monthly chart or even a weekly chart, you may in a trading range in the bigger picture.
Price Action Reversals In Support/Resistance Zones
I hope this Forex chart will shed some light on what I’m talking about here about trading price action reversals. This is a 4 hr time frame chart of EURAUD (even though its not shown there as I trimmed it to keep it small).
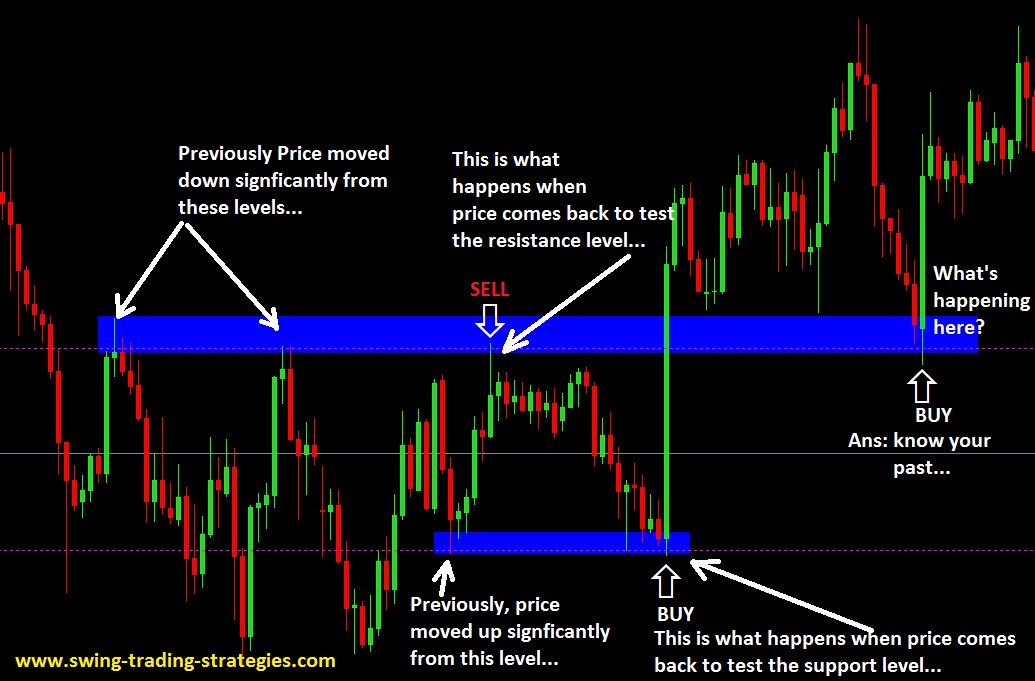
PRICE ACTION REVERSALS ON SUPPORT AND RESISTANCE LEVELS
WHERE OR WHEN DOES PRICE ACTION TRADING COME INTO PLAY HERE?
Well, now that you know what type of reversal candlesticks to watch for, you wait until price reaches the support or the resistance zone and then you take your trade or trades.
But what if you are watching in the 4 hr time frame and none of the reversal candlesticks that you expect to see do not form? What would you do?
Well, if you have been watching only in the 4 hr time frame and you do not see any reversal candlestick patterns and price moves away from the support or resistance level than as far as I am concerned, you’ve missed your entry.
Why?
Because you did not see a reversal candlestick in the 4 hr time frame.
Which leads me to this vital key to trading price action reversals…….
Multi-Time Frame Trading
Let me explain this concept of multi-time frame trading and I think you will see how it makes sense to utilize it in your own Forex trading.
In a 4 hour candlestick chart, how many ‘1 hr candlesticks’ have to be completely formed to create that one single 4hr candlestick chart?
Four.
Similarly, in a completed 1 hr candlestick chart, how many 30 minute candlesticks are there? How many 15 minute candlesticks are there? And How many 5 minute candlesticks are there?
The answers are very obvious so what’s my point?
The 4 hr chart has four 1 hr candlesticks and, eight 30 minute candlesticks etc…
So what if while the 4 hr candlestick chart was still forming and in the 1 hr or in the 30 minute or in the 15 minute chart, a bearish reversal candlestick formed?
That’s what’s multi-time frame trading is all about.
You may have wait for trade setups to happen in the larger time frames like the daily or the 4 hr charts but you use the smaller time frames to enter your trades.
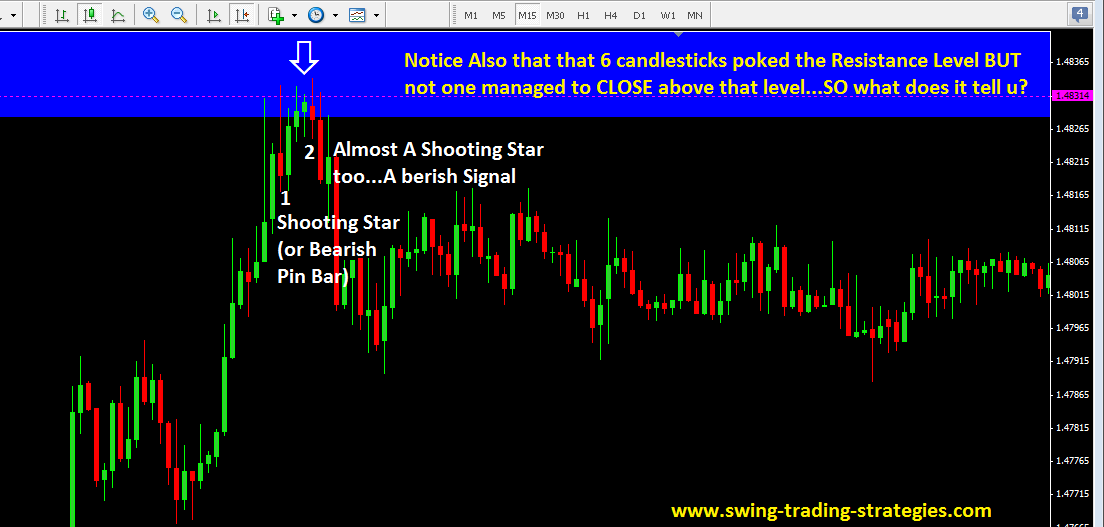
The chart below is 15 minute timeframe chart looking at the “SELL” signal of the 4hr chart above. Can you see the difference between trying to enter a trade in the 4hr chart (above) vs entering a sell trade using the 15 minute chart below?
Which chart gives you clear bearish reversal candlestick patterns?
Trading Price Action Reversals Using Reversal Candlesticks
CONCLUSION
- Trading price action reversals is a simple process if you learn to identify support and resistance levels and you know what specific reversal candlestick patterns to look for.
- Learn to trade in a multi-time frame environment. If a trade setup happens in 4 hr time frame, it does not always means you should take the trade in the 4 hr time frame….switch to the smaller time frames for better entries. If you are interested, click this link: best list of free Forex trading strategies on this website, check it out.
Updated – 2017
 Posted in
  Tags:
Tags: