


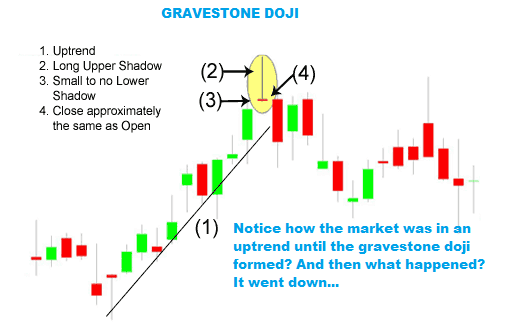
The gravestone doji reversal candlestick appears in an uptrend which can tip a trader off that the market is becoming bearish.
Due to the nature of the gravestone doji, trading this candlestick in relation to a properly formatted trading plan can give you some great shorting opportunity.
The best case is the gravestone doji signifies a reversal of a trend so finding one at a market top can set a trader up for a swing trade that can amass some heavy pips.
Market tops are only seen in hindsight but there are some things you can look for prior to the appearance of a gravestone doji and we will cover that later.
GRAVESTONE DOJI DEFINITION
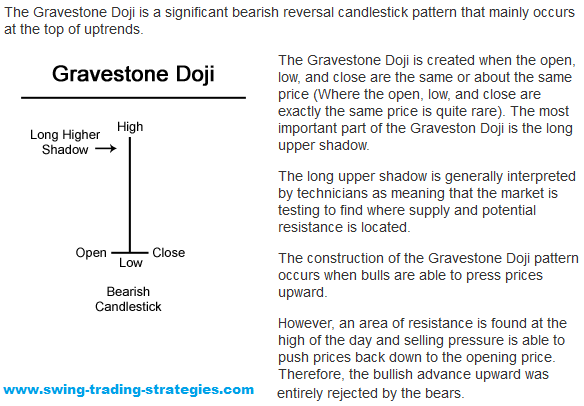
The gravestone doji is created when the open, low, and closing price are either the same or extremely close in price. While that may be hard to see, another important aspect of the reversal candlestick is the long upper shadow or wick that appears.
When a long shadow appears and the closing price equals the low and open price, the market has:
- Probed higher for order flow as the bulls push price higher
- Found enough sellers to form a resistance zone
- Selling pressure at the high of the day forces price back to the low and open price
- The bulls were soundly defeated by the bears.
What A Gravestone Doji looks like
GRAVESTONE DOJI – BEARISH REVERSAL CANDLESTICK PATTERN
As mentioned, the gravestone doji is not only a bearish candlestick but is also a reversal candlestick pattern. Traders should be on alert when one is found:
- In a steady up trending market
- After signs of exhaustion of the up move
- On a higher time frame chart
In this context, price is exhausting to the upside where the last interested buyers have come into the market. When no more buyers appear and price stops going higher, astute traders begin to exit the market.
Trading The Gravestone Doji As A Trading Method
Like all candlestick patterns, context plays a part especially if you are looking to trade a reversal in an uptrend. If you are wrong, and you will be, price will continue its advance and take out your stop loss.
Some questions you can ask when a gravestone doji appears on your chart.
- Has the market been in a steady uptrend? If so, we can consider a trade
- Is price reaching above a significant price high? If so, we have a probe of higher prices and the opportunity to catch traders trapped in long positions.
- Is price action showing some type of climax move to the upside? If so, we may be seeing the last of the interested buyers participating in the current trend.
Gravestone Doji Context
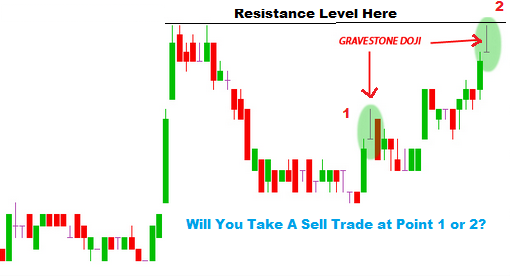
This chart shows you two locations where a gravestone doji appears and we can consider a trading the reversal. Can you see trades at both locations?
No.
Before we go on, I want you to consider that for the majority of time, the price action we are seeing is more random than intent. What this means is while each individual trader will have reasons to trade, on a whole, there are many competing reasons at most places on the chart.
At certain locations however, we begin to see a larger group taking the same action. Their methods may be different but it is based on market principles. These are generally bigger players because retail traders just aren’t that good (that is statistics).
- This appears to be a breakout failure and is not appearing at a significant point on the chart. Trading the gravestone doji at this location would be a loss. The market is not trending at this point and that should be your first clue to that ignoring this reversal is the best course of action
- Price is making a stair stepping uptrend pattern. Momentum candlesticks are appearing as price makes its way to a resistance zone that is obvious and was made with thrust
The chances of the success of the reversal is great at point one.
Stop Loss Location
Keeping in mind that the gravestone doji is a reversal candlestick and did probe higher only to be rejected, placing your stop loss in a location which shows that buyers are still in play makes sense.
For this candlestick pattern, a few pips off the high reversal point of the gravestone candlestick would make a great location to exit if the market still seeks higher prices.
Technical Analysis Tools + Gravestone Doji
There is a handful of forex trading strategies which you can use to trade the gravestone doji candlestick pattern. Keep in mind that lines on a chart hold no special meaning and at times are no better than a random line.
Trend lines for example can be drawn many different ways which should be an alert that they may not be in locations that hold any special meaning.
Regardless, trading the gravestone doji along with other technical tools inside of a well tested trading plan can work well.
At Touch of Downtrend Trendlines by using the trendline trading strategy:
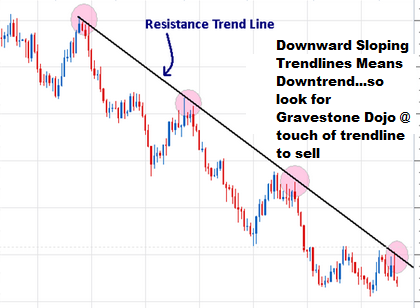
Gravestone Doji – Trading Trend Lines
Fibonacci Levels
Look to trade the gravestone doji on fibonacci levels similar to this daily chart forex trading system:
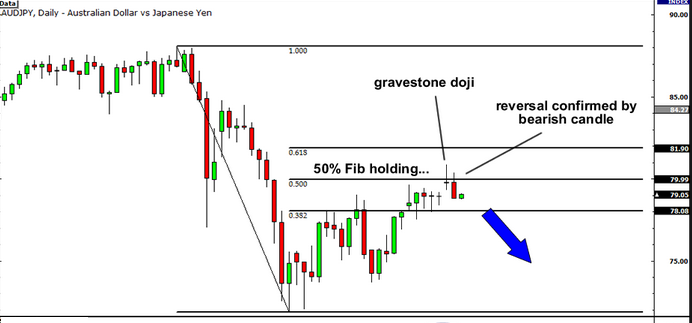
Trading Gravestone Doji With Fibonacci Level
Moving Averages
You can trade gravestone doji’s by using Forex trading strategies similar to the floor traders forex trading strategy or 200 ema moving average trading strategy.
Using a moving average can allow you to be more objective in trend direction and give you another location where the gravestone doji candlestick may produce a winning short trade.
IN SUMMARY
- Gravestone doji’s are bearish reversal candlestick patterns, you look for them when market is in an uptrend to catch those downward moves.
- trading gravestone doji’s all by itself does not make any sense if it does not form in areas of resistance.
- these resistance levels can be horizontal resistance levels from previous price rejection levels, or resistance provided by fibonacci levels or resistance provided by the bounce of moving averages similar to the forex trading strategies listed above in (3) like the floor traders method and the 200 ema moving average trading strategy.
 Posted in