


Why are moving average trading strategies so popular?
Moving averages are popular because they smooth out price “noise” and a quick look at a chart will show that trading the moving average crossover is an effective trading strategy.
Or is it?
WHAT IS A MOVING AVERAGE? A very popular technical indicator showing the average value of of a particular currency price over a set period of time.
The keywords are average value and price which means that moving averages need price in order to calculate an output. This is one of the biggest drawbacks of moving averages or virtually any trading indicator – they lag price
Price moves first and the indicator moves second which, if you are mechanically using a moving average trading strategy, will always have you late to the trade.
4 MAIN TYPES OF MOVING AVERAGES
Virtually all chart packages for Forex, Futures, Stocks or any other market will have the moving average indicator. There are 4 widely used moving averages:
Simple Moving Average
The most commonly used type of moving average, the simple moving average (SMA) is calculated by adding and then averaging a set of numbers representing the market. The SMA is by far the more popular mode, and it is considered highly useful because of its smoothing effect.
The SMA emphasizes smoothness, that is, it tries to smooth out the erratic behavior of the market in order to see the trend. However, there are those who do not like the fact that the SMA lags behind the latest data point by nature of its smoothing, and they prefer to give more weight to more recent data points, as in the weighted moving average (WMA) and exponential moving averages (EMA).
Exponential Moving Average
The Exponential Moving Average (EMA) is calculated by adding the moving average of the trading instrument of the current closing price to the previous value. Exponential moving averages assign more meaning to the recent prices and less to the closing price from the period’s beginning. Thus it is faster at detecting a trend reversal.
Naturally, and depending on the length, it can be more susceptible to market noise which can result in traders getting caught in whipsaws.
Smoothed Moving Average
A Smoothed Moving Average is sort of a blend between a Simple Moving Average and an Exponential Moving Average, only with a longer period applied (approximately, half the EMA period: e.g. a 20-period SMMA is almost equal to a 40-period EMA)
Linear Weighted Moving Average
Calculated by multiplying each one of the closing prices within the considered series, by a certain weight coefficient. Like the EMA, the LWMA assigns more meaning to the recent prices and less to the closing price from the period’s beginning. Thus they are faster at detecting a trend reversal, though it they can be more prone to market noise.
Warning: Do not get caught up and waste your time in deciding which is the best moving average to use. There is no best. I can tell you that most traders I know use the simple moving average (SMA) because they use the moving average as a guide – not in deciding to make a trade.
Here is an example of the different moving averages applied to a chart.
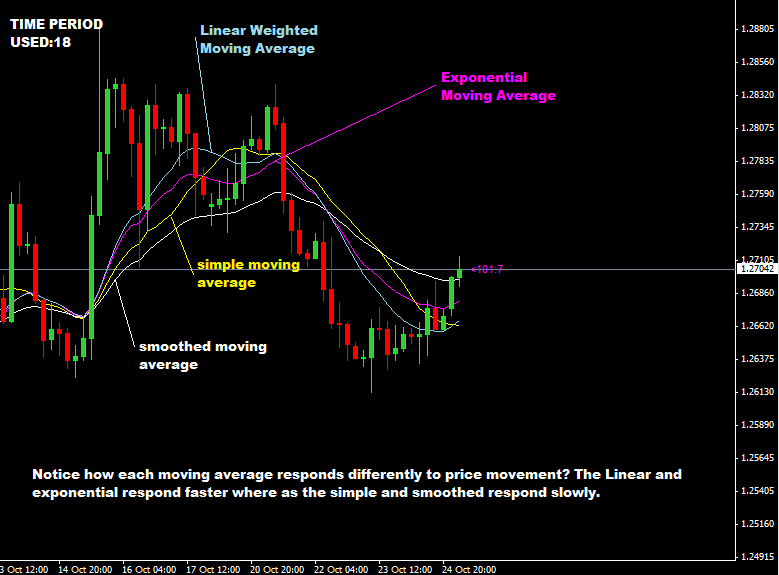
I think you can see the on a macro level, there is not much different between any of the averages.
How To Use Moving Averages
Moving averages are a great way to determine the trend direction of your instrument. While price action and structure is my preferred way, you can get a general idea of the market direction with a moving average.
You can use the slope of the moving average: up sloping is an uptrend and down sloping is downtrend.
You can use price location: if price above moving average, look for long trades. Below the average you would look for short opportunities.
If you are using a moving average crossover strategy, you would look for the placement of the fast moving average in relation to the slow moving average.
- Fast line crosses over to the upside = uptrend
- Fast line crosses over to the downside = downtrend
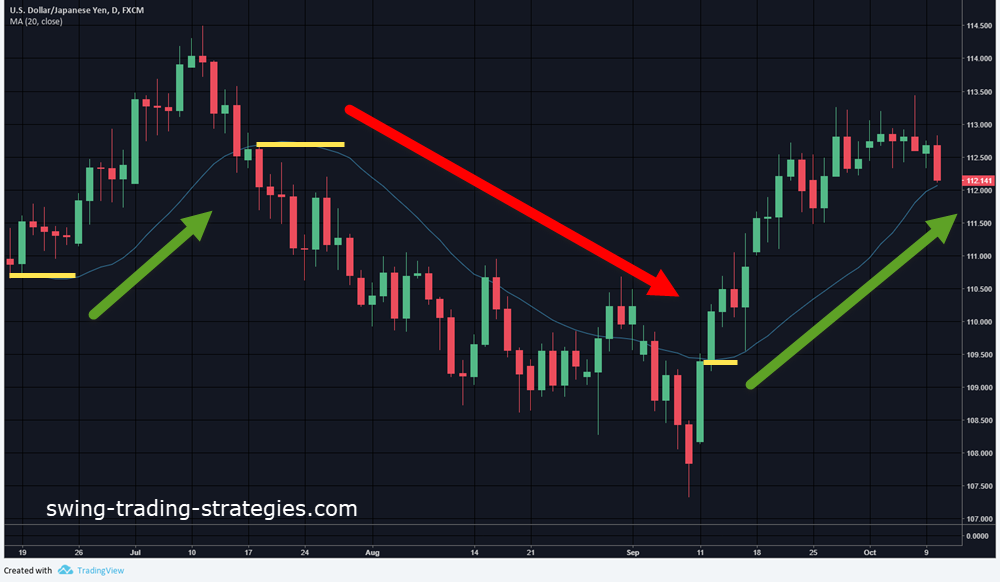
This is a 20 period simple moving average (SMA) and the arrows highlight the trend direction taken from the slope of the moving average. The yellow lines indicate where the moving average is flat which would have you not taking any trades if you were using slope as your trend direction.
You can see that price can cross the moving average and then fall on the other side. This is where using the moving average as your only approach to trading is dangerous. Always allow a little “splash” around the moving average.
Moving averages will help you with mean reversion which means pullback trading. Believe it or not, there is an edge in trading pullbacks as long as you don’t believe that support and resistance happens with a moving average. It doesn’t.
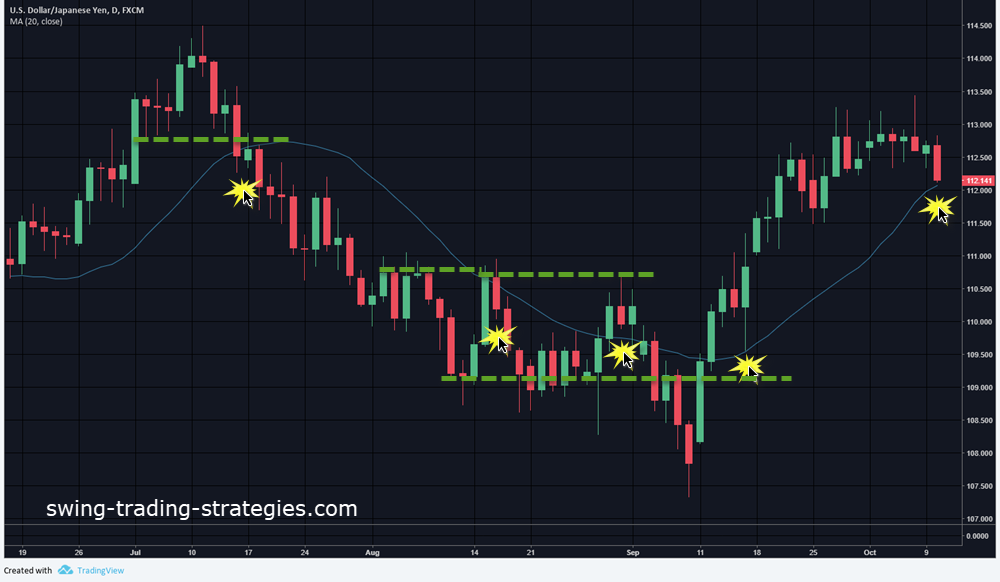
With this simple trading strategy, we are looking to trade pullbacks in the area around the 20 SMA and also looking for previous structure.
All the highlighted zones show price pulling back to the moving average but also to previous chart structure. The trade entry is simply entering the trade below the low or above the high of the final pullback candlestick.
You can also use a price action entry strategy to take advantage of these trade locations.
This is a perfect example and they will not always look like that.
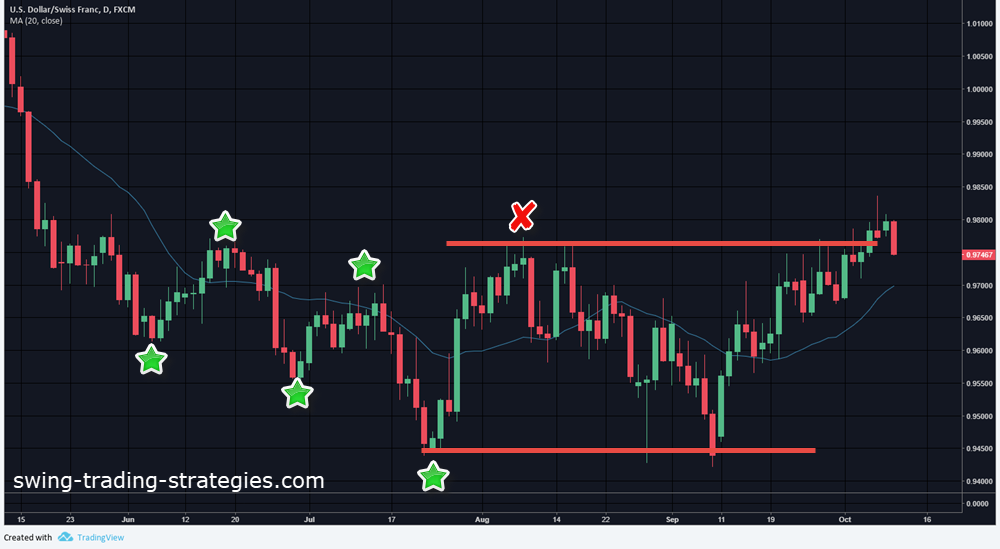
This chart shows how messy trading can get. Once you see price whipping back and forth over the moving average (EMA, SMA – doesn’t matter), you are looking at a chart in chop.
The green stars show a down trending pattern of lower lows and lower highs. The red X shows where the price pattern breaks down and once the red X level is not taken out, you may want to also stand aside as the market is appearing to form a range.
While the trend change is problematic if using price placement, you can use those zones for pullback trades and you can see on this chart they did pretty well.
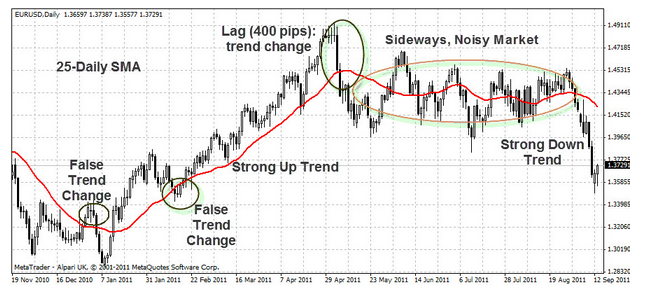
The lag time of the moving average is clear when price moves 400 pips to the downside before showing a trend change although price action trades would read that momentum as a break in trend.
The moving average has price whipping back and forth and that is a market in a range and something you do not want to trade.
Can You Fix The Problems With Moving Averages?
One of the best ways to fix an issue with any technical indicator is to have a strong understanding of price action and certain chart patterns. Make sure you read my entire swing trading strategies blog – it’s all free!
MOVING AVERAGE TRADING PROBLEM #1: LAG
Moving average is a trend following indicator. It can only tell you when the trend has already happened. You can’t forecast a new trend with a moving average because its a lagging indicator.
You will notice that in the chart above the moving average was still rising whilst price hit the resistance level at around 1.4911 and went down by 400 pips plus.
FIX: Reduce the length (number of day etc) in the moving averages. This will make it more responsive to price movement because the shorter moving average is more responsive to price movement. Or use a more responsive moving average like the exponential moving average (EMA) or liner weighted moving average. There is a trade-off with a faster moving average – faster response to price change = more chance of whipsaw.
MOVING AVERAGE TRADING PROBLEM #2: NOISE
One of the best things about using moving averages for trading is that moving averages are designed to smooth out the erratic price data so that you can be able to detect the trend and stay with the trend. However, even the best moving averages suffer from noise. This happens when the market has volatile price spikes and even short term corrections and this can make price escape out of the containment area of the moving average.
FIX: Here are some options. Apply more days/periods to the moving average and the result of this is that it smooths it out and make it less responsive for example: instead of using a 25 simple moving average, you can use a 50 simple moving average. Opt to using simple or smoothed moving averages…this allows you to reduce the noise.
Big drawback – if you use the moving average as a stand alone trading strategy you will be late the every single trade. You may be entering, as in the example, over 400 pips late just when the market may be looking to bounce
MOVING AVERAGE TRADING PROBLEM# 3: SIDEWAYS MARKET
Nothing is so frustrating than trying to use a trend trading strategy in a sideways market! Your stop losses do not stand a chance! Regardless of what type of moving average you use in a sideways market, they will not work effectively. There will be too many false signals.
You are better of using range trading strategies instead of moving average trading strategies during a sideways market. The problem with sideways market is you can never know for sure until its happening. You cannot predict it in advance.
FIX: One of the best ways to keep out of trading sideways market is knowing what kind of period you are trading in. If you know that it is a holiday period the big money traders are on holidays, then obviously there will be less volume and volatility in the market so the market will be in sideways mode.
Or if you don’t know, the Asian Forex trading session also tends be a sideways market but starts to trend when the London session opens and this trend generally continues into the US Forex trading session. So knowing this kinds of information helps you in staying away from the markets as there is potential for sideways movement.
Learn price action. You don’t need to know everything from chart patterns to individual candlesticks but understand what pattern a trending market makes.

 Posted in