


There is no best moving average crossover strategy for swing trading regardless of what anybody tells you.
All we can do as swing traders is put the odds in our favor by using a few technical indicators as well as price action. We need an edge and even a small edge can build your trading account if you trade it consistently.
This swing trading strategy will use a few technical analysis tools that are designed to show us if we are in an environment that supports a trade.
- We are going to use 2 moving averages to determine the direction of the trend. For this strategy, we are going to use the 5 SMA and 10 SMA (simple moving average)
- The stochastic indicator will be used with the settings 14,3,3 and the levels 80 and 20. We will use these levels to indicator an oversold/overbought market condition
- The RSI (relative strength index) will be set to 14 and we will use the 50 level to help confirm a strong trending environment.
Consult your trading platform user manual to show you how to apply these technical indicators onto your chart.
What A Moving Average Crossover Means
There is nothing magical about any moving average crossover. Even the so called “golden cross” doesn’t pan out in extensive testing as having any deep meaning. Moving averages, like all technical analysis indicators, are derivatives of price.
Moving averages simply calculate the average of X number of price points in the past. Obviously when a trend is slowing down the price range decreases and you start getting closing prices closer to the one previous.
What may appear to be a moving average supporting price is simply an artifact of slowing price action which allows the average to catch up to price.
When we use it for trend direction in the crossover, all we are seeing the average of the previous 5 closes and the average of the previous 10 closes are getting smaller. You eventually see the crossover occur.
We will use the cross as the first indicator for a sell signal or a buy signal.
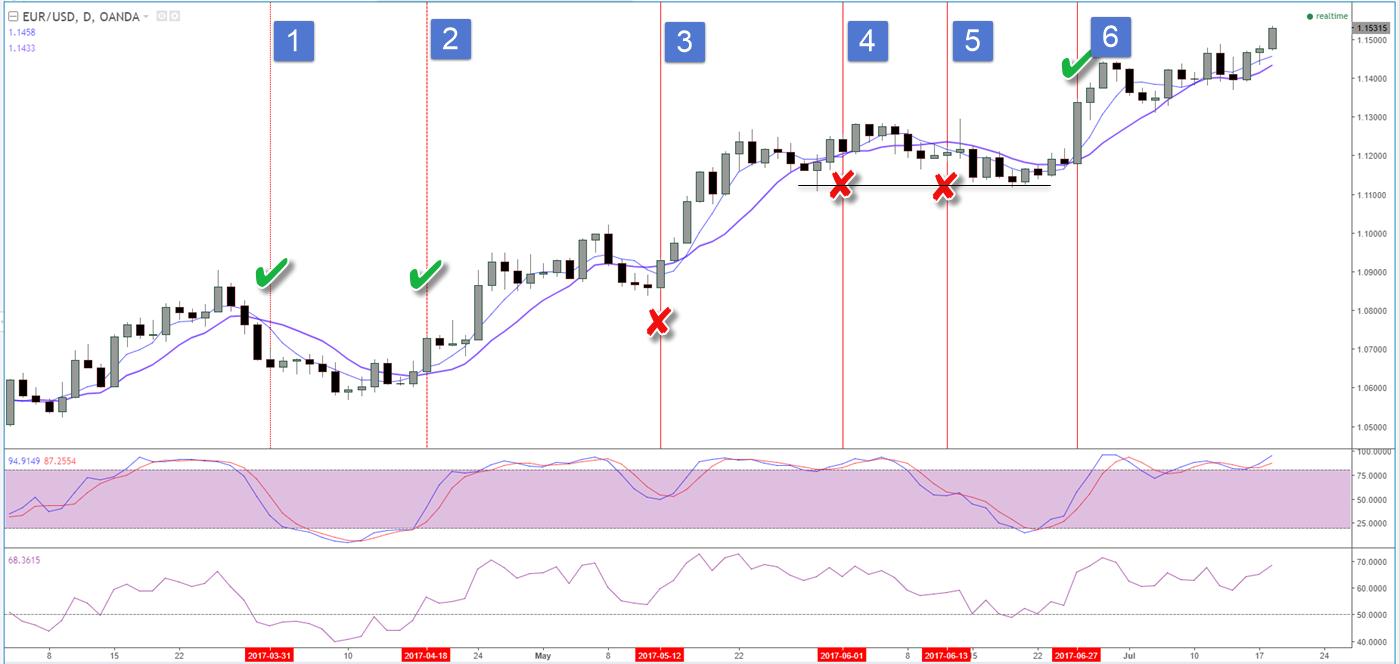
This is the daily chart of the EURUSD. Since we are looking at swing trading strategies, I much prefer longer term time frames for trading so swings can actually develop that have the potential to run. Choose the time period you want to trade and be consistent.
If you are trading a daily chart, avoid the temptation to zoom in or out to a different time period to convince yourself of a trade. You also want to monitor any current positions on the time period you entered the trade on.
A few key points:
- The 5 and 10 SMA are a fast and slow moving average which we will use for the first signal in our trade setup. They will help us define the new trend direction.
- The stochastic will be used for oversold and overbought. We won’t ignore the cross of the lines if they take place around the 50 level. We only care about this indicator if the moving averages have crossed.
- The RSI will be one more tool to see if price is either breaking down for shorts or is gaining strength for a buy signal. This is the last variable in a buy or sell signal.
We will not ignore price action or support and resistance. Nothing pays but price and you will see an example where price structure would have had you sitting on your hands (although the setup never does confirm).
What Is A Sell Signal?
These numbers do not represent what we see on the above chart. That will be discussed after you learn the setups.
- Wait until 5 sma crosses 10 sma to the downside
- Wait for the candlestick that forced the crossover to close.
- Look down and see if the Stochastic indicator either above the 80 level or has started to head down below the 80 level.
- Check to see if the RSI indicator is breaking through the 50 level
- If both 3 and 4 are true, then place a sell stop order 3-5 pips below the low of the candlestick
- Your stop loss can be above the high of the last candlestick or a 2 bar high.
What About Profit Taking?
You can trail your stop loss above each lower high to really get some home run trades. You could also exit on the next crossover or if there is signs of exhaustion coming into the market.
I will say it again…whatever you choose to do, be consistent in your approach. This is where using a trading plan and logging all your trades will be important. You can’t fix what you don’t track.
What Is A Buy Signal?
Your signal to buy is the exact opposite as a sell signal.
- Upside cross of 5 and 10 SMA
- Wait for close candlestick
- Stochastic is below the 20 level and rising ( or recently crossed)
- RSI is breaking 50 level
- If 3 and 4 are true, place a buy stop order 3-5 pips above the high
- Your stop loss can be below low of previous candlestick or 2 bar low.
Swing Trading Example Of Crossover Strategy
You can open the chart above in a new window so you can follow along.
- Everything sets up nice for this sell signal. The crossover occurs to the downside. The stochastic has recently turned to the downside and RSI has broken 50. We don’t get a lot of price movement here but we also have just come from a period of price movement that made up an ascending triangle.
- You could exit the previous trade here. This is a beautiful buy signal as the crossover occurs, Stochastic is rising and RSI has just broken 50
- No sell signal so no trade exit. RSI doesn’t touch 50, Stochastic crosses back up around the 50 level.
- No sell signal as Stochastic still bullish, RSI still strong.
- No sell signal. Stochastic has turned and so has the 5 and 10 SMA but RSI is still bullish. Also notice that when RSI bottoms at 50, the black line on price is showing support structure. We can also see the Stochastic is heading toward oversold and that combined with our support equals no trade and no long trade exit.
- If you missed the original long or like to add to positions, you can get on-board here. I won’t describe it…..what do you see?
That initial long trade is up 796 pips as of this chart!
In Summary
This is a great swing trading strategy that harnesses the power of common technical indicators:
- Moving averages
- Relative strength index
- Stochastic oscillator
We also included common price structure (support and resistance) and we need price action to get us into the trade via stop orders.
As will all swing trading strategies on this site, test them, tweak them and prove to yourself they can work.
Please like and share this blog post is you found it helpful!
 Posted in