


Today we’ll look at the most basic form of a fading system based on the RSI indicator. You may have already used the 20SMA with RSI Swing Trading System. The RSI Indicator strategy uses the RSI and 20 SMA to time entries on pullbacks in a trend. The RSI Fade on the other hand uses the RSI to identify reversals.
Figure 1 below shows the strategy applied to a 60 minute chart of the EURUSD. The yellow circles indicate where the 30 and 70 RSI levels are crossed, the arrows indicate the setup bars. The dark blue lines are the entry levels and dark red the stop levels.
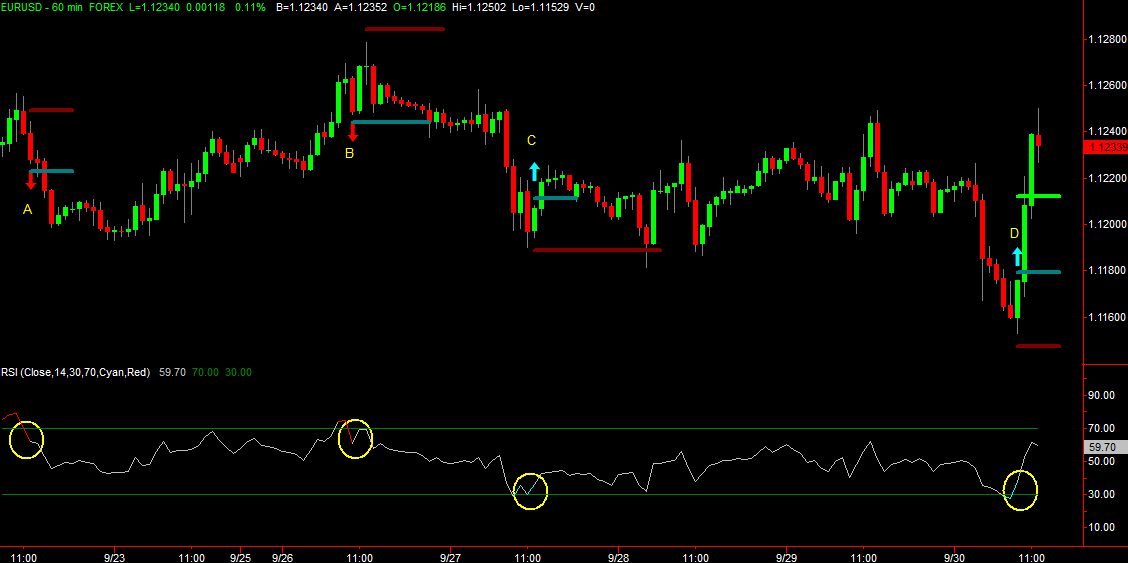
Figure 1
The RSI Indicator Strategy rules for long trades are:
- If RSI crosses above the 30 level we have a setup bar.
- Place the entry three pips above the high of the setup bar.
- Place the stop five pips below the low of the setup bar.
- Place the target so that the distance from entry to target is the same as the distance from entry to stop and we have a Reward:Risk ratio of 1.
- If RSI crosses back below 30 before the entry is triggered then cancel the setup.
- If the entry has not been triggered and a swing low forms below the initial stop level, move the stop below the swing level and adjust the target so that the Reward:Risk ratio remains at 1.
For the RSI Indicator Strategy short trades:
- If RSI crosses below the 70 level we have a setup bar.
- Place the entry three pips below the low of the setup bar.
- Place the stop five pips above the high of the setup bar.
- Place the target so that the distance from entry to target is the same as the distance from entry to stop and we have a Reward:Risk ratio of 1.
- If RSI crosses back above 70 before the entry is triggered then cancel the setup.
- If the entry has not been triggered and a new swing high forms above the initial stop level, move the stop above the swing level and adjust the target so that the Reward:Risk ratio remains at 1.
In the rules we use entry and stop offsets of three and five pips respectively for the EURUSD 60 minute chart. You should adjust these offsets based on the pair that you are trading and the time frame of the chart. For example, on a four hour or daily chart you should increase these offsets, say to five and ten pips or more.
In Figure 1 above we see four RSI Indicator strategy setups. Let’s see how each performed using the RSI Fade strategy.
- A: The short trade triggered on the next bar and 9 bars later hit the 100% Reward:Risk target.
- B: The short trade triggered 11 bars after the setup. Since a new swing high was formed before the trade triggered we moved the stop above the swing. Twelve bars after triggering the 100% Reward:Risk target was hit.
- C: The long setup triggered on the next bar and 15 bars later stopped out for a loss.
- D: The most recent long setup also triggered on the next bar and actually hit the 100% Reward:Risk target on the same bar. The green line indicates the target level.
The RSI Fade system does a good job in keeping us out of choppy markets. Consider the 4 hour EURUSD chart in Figure 2 which shows the month of September.
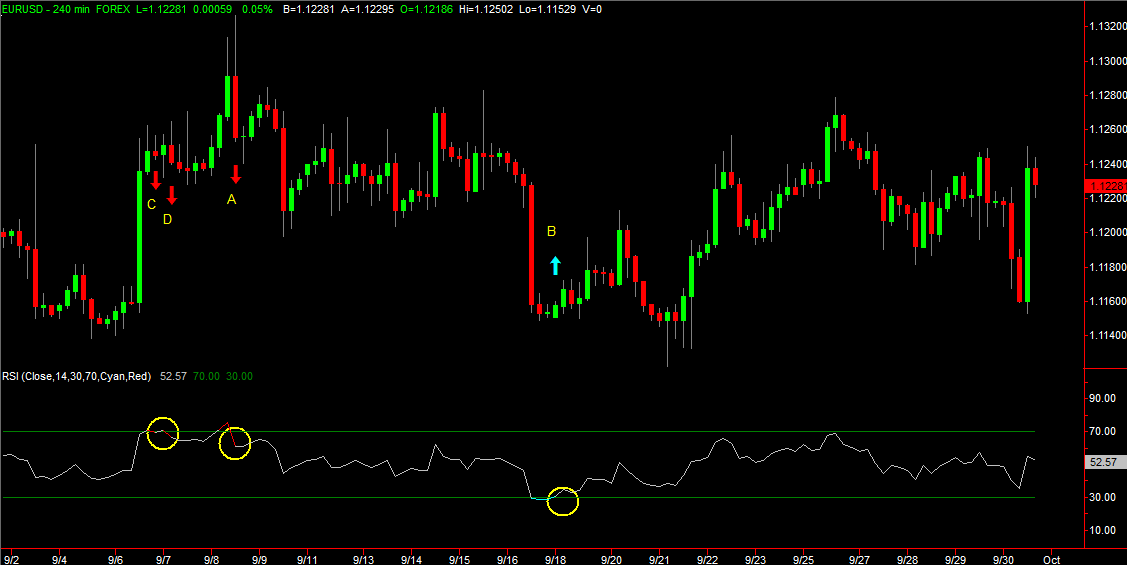
Figure 2
Setups A and B both resulted in 100% Reward:Risk wins and there haven’t been any new setups since the one on 9/18, which is exactly what you want to see with this kind of choppy price action. Setups C and D however show one of the problems with the strategy, and that is that in a strong trending move the system can give premature setups. Both of these setups failed. On closer inspection you’ll notice that in both cases the RSI had barely crossed above the 70 level (70.52 and 70.60) before crossing back down. This suggest that it may make sense to add a second confirmation level for the cross, as we used with the CCI strategy last week, or perhaps to look for setup confirmation with a close below a trailing moving average. We’ll explore ways to improve basic strategies like the RSI Fade in a future article.
Look at some of your favorite pairs and time frames with the RSI Fade system. You may want to use this as a stand alone system or in combination with your current strategies. You could for example use the RSI Fade simply to filter out choppy price action if you’re using a trending system. This in itself can greatly improve your results. Or consider using trailing stop strategies to improve the Reward:Risk ratio, or alternative targeting strategies. As stated at the beginning of this post, this is a very basic system and can be used as a building block for something more advanced.
Good luck in your trading with the RSI Indicator Strategy Fade system.
 Posted in