


The popularity of candlestick charts for trading with exploded when they arrived on the scene and for very good reason: The amount of information you can get from a casual glance at the candlestick chart makes chart reading much easier.
Each candlestick contains 2 parts regardless of the time period you are trading:
- the body which is the wider part of the candlestick
- the shadows or wicks that appear at either end (sometimes) of the candle.
These parts of the candlestick represent for each candlestick:
- the opening price
- the closing price
- the highest price
- the lowest price
It is a graphical representation of price fluctuations for any instrument on any time frame.
Each candlesticks will display the relationship between those four prices and will make it easy to read which side, bulls or bears, took control of the trading session. There are some traders who disregard the highs and lows of the sessions and only use the bodies of the candlesticks, open and close, for trading decisions.
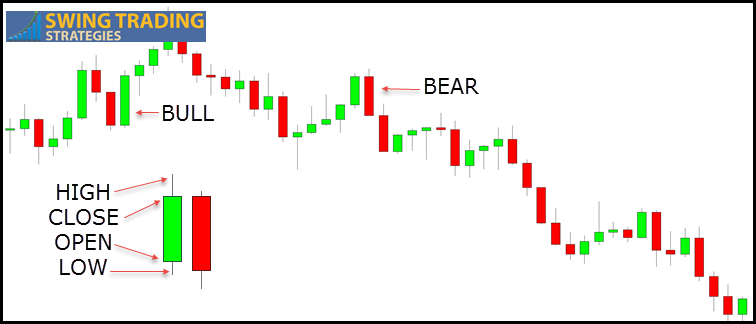
JAPANESE CANDLESTICK CHART
New Candlesticks Equals New Information
The building of each candlestick on your chart will display the opening price and that will occur at either the top or the bottom of the body.
The highs and lows of the session will be shown by how far the upper and lower wicks travel. There will be times where no wicks appear and that is called a “shaved candlestick”.
The closing price is the last item to plot and will once again be shown on the body of the candlestick.
Generally, if the close is lower than the open, the candlestick will close red meaning the bears were in charge of the session covered by the candlestick
If the candle closes green, the close is higher than the opening price.
During the formation of a candlestick, you will often see the color change from red-green-red-green, as the battle between buyers and sellers plays out. The only part of the forming candlestick chart that does not change is the opening price. All others, the highs and low will change and ultimately end at a closing price that will remain. The highest price and lowest price that was reached during that session will be plotted via the wicks.
Candlestick Color Shows Direction
When the candlestick closes, traders can immediately see which direction of price, high or low, won the imbalance battle for that time period.
- Green closes indicate strong buying intent on that time frame
- Red closes indicate strong selling intent
You can also determine at a glance how far price moved in relation to candlesticks that preceded the most recent one. For a more objective view, the difference between the high and low of the candlestick will determine the actual price range for that period.
Knowing the range can help a trader determine if momentum is building in that instrument that is being traded.
Candlestick Characteristics
You can determine through your charting platform the color of the bullish candlesticks and the bearish candlesticks. You can also you hollow candlesticks as opposed to the filled in ones. Some traders find color a distraction while others prefer the easy viewing of the color filled candles.
There are cosmetic changes and regardless of how you view your charts, the information is the exact same.
Popular Candlesticks For Trading
While I’ve not seen any statistical validity to using individual candlesticks for trading decisions, here are some of the more popular ones used by traders.
5 main bullish candlestick patterns
- The Hammer
- The Piercing Line
- The Bullish Engulfing
- The Morning Star
- The Bullish Doji Star
5 main bearish candlestick patterns
- The inverted hammer or some call it the shooting star (looks like one though…)
- Than Hanging Man.
- Dark Cloud Cover
- Bearish Harami
- Bearish Engulfing Pattern
4 neutral candlestick formations
- spinning tops
- the doji
- the double doji
- the harami pattern
4 reversal candlesticks
- Long legged doji
- the dragonfly doji
- the gravestone doji
- stars
Summary
Candlestick charts are popular for a reason and virtually anybody who trades has seen them. Learning about Japanese candlesticks and how to trade them can be another tool for the traders tool box.
As always, ensure you have fully tested any approach to trading you are using.
 Posted in