


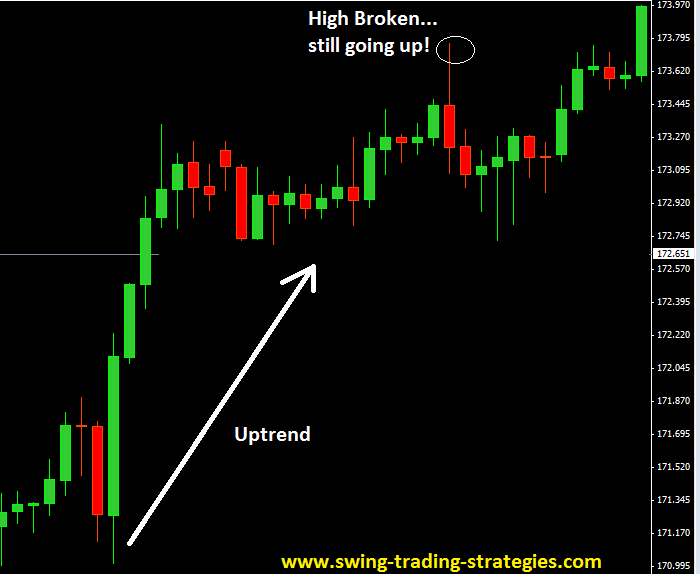
One of the best forex trading techniques to catch the beginning of a new trend and make a lots of pips (when the new trend continues in its new direction) is none other than using simple support and resistance trading techniques and price action.
Here’s how…
This is what you see first:
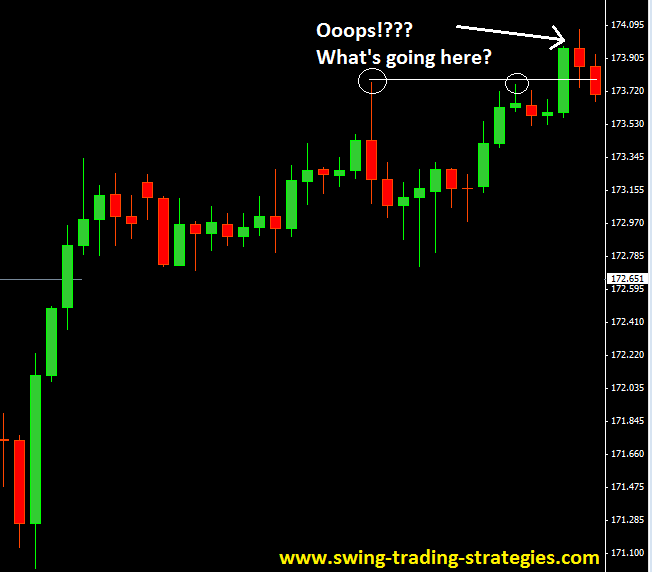
This is what you see next:
And then this happens:
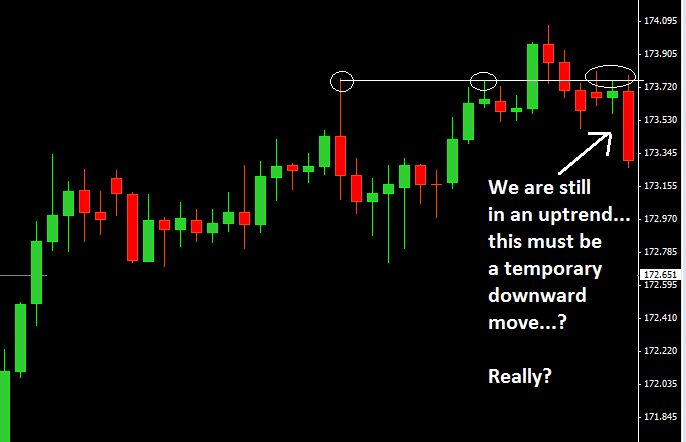
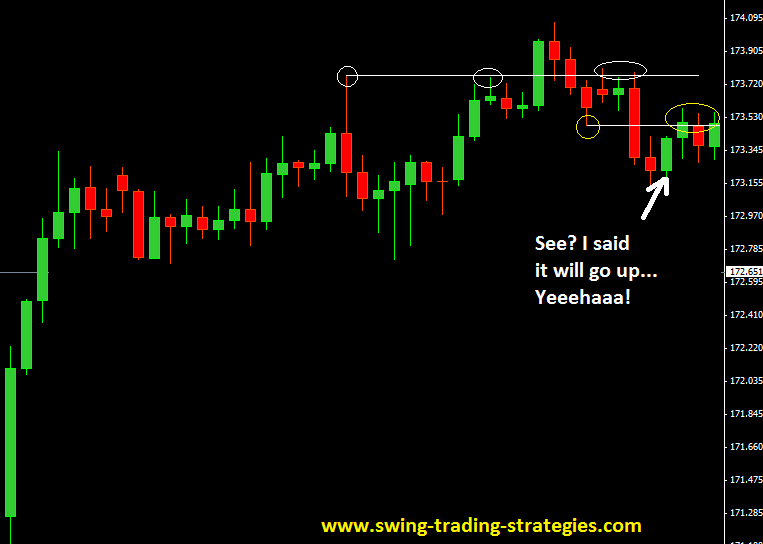
See? I told you we are still in an uptrend…the price will continue to move up. The uptrend is not finished yet:
Is the market still going up???:
HERE’S YOUR PROBLEM
Its much easier to say that “you can buy here or there and sell here or there” on a forex chart “after” the event has happened because now you can see “what has happened” in the past.
But one skill that needs to be learned as a forex trader who is interested in swing trading, especially if forex technical analysis is your bread and butter is to have the eye to see what can potentially happen in the future by looking at price action of the past and the most recent price action.
One of the best ways to do that is using support and resistance levels and price action behavior.
The last chart above, actually gave two clues prior to the market trading lower.
I leave it up to you to figure it out….
But in case you can’t figure it out here they are:
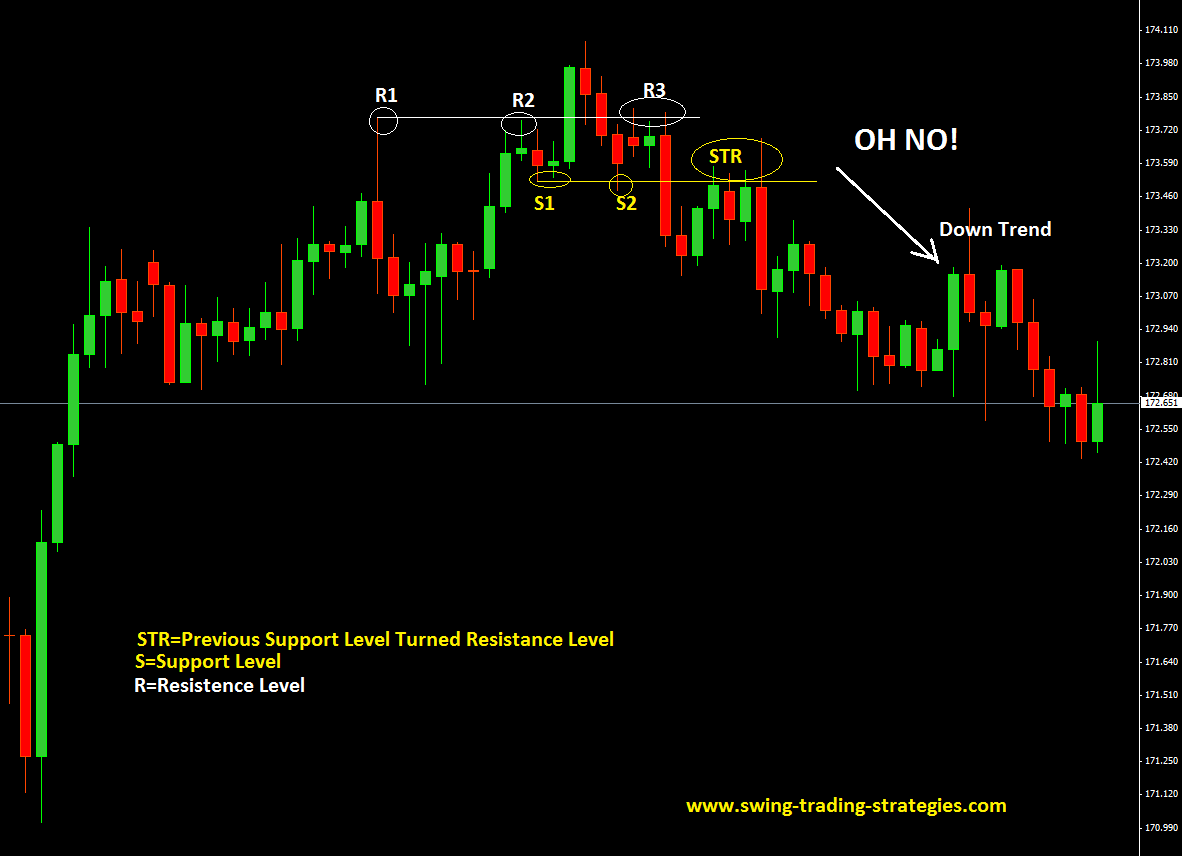
CLUE #1 FOR TREND CHANGE
- price intersected R2 and went up but came down but here’s the thing…the R1&R2 line would have now acted as Support Level for that price to bounce back up from…but that did not happen!
- Instead price went past that R1&R2 line without any signs of stopping and hits a support line S1 and then bounces back up forming another support level, S2.
- Now price goes back up and hits the R1&R2 line that it intersected previously and guess what happens there? It finds resistance, R3 there and its pushed down from there.
- Where would have been the best places to take the trade? I would have gone short as soon as price hit R3 level because I know price did not stop from on the R1&R2 level and I would have anticipated that price would bounce back down from there.
- Or you could wait for a bearish reversal signal in the the R3 resistance level and enter a short trade based on that. Did you notice the Bearish Reversal Candlestick Pattern, the Shooting Star in the R3 level? That’s your signal and confirmation to go short.
CLUE #2 FOR TREND CHANGE
What if you did not see clue #1 and missed entering a short trade there? Well, another opportunity presented itself right after the first clue.
- after price hits the R3 level, what happened? If fell back and support level S1 & S2 could not stop price from going down! It broke the support level there with no signs of hesitation.
- But then price starts to climb back up. This is where opportunity presents to go short but many forex traders fail to understand or fail to see it happening simply because they do not fully understand how support and resistance levels affect price movements.
- When price hits the level (or zone) STR, it falls back down. That STR level (or zone) is where a short trade could have been initiated.
CONCLUSION
So where did the trend actually changed from uptrend to downtrend?
- In my opinion, clue#1 was the signal that gave anybody that heads up that the uptrend may be ending because R1 & R2 were supposed to keep price bouncing upward but that did not happen at that level.
- Clue #2 was much more solid confirmation when the support levels S1 & S2 were broken and when price came back up, these two support levels acted as STR and pushed back the price down and you should notice that from there on, it was all downward move, a downtrend.
 Posted in
  Tags:
Tags: