


TREND TRADING IS NOT DIFFICULT IF YOU CAN USE PRICE ACTION TO DETERMINE TRENDS
Here’s how…but first some basic lessons first:
-
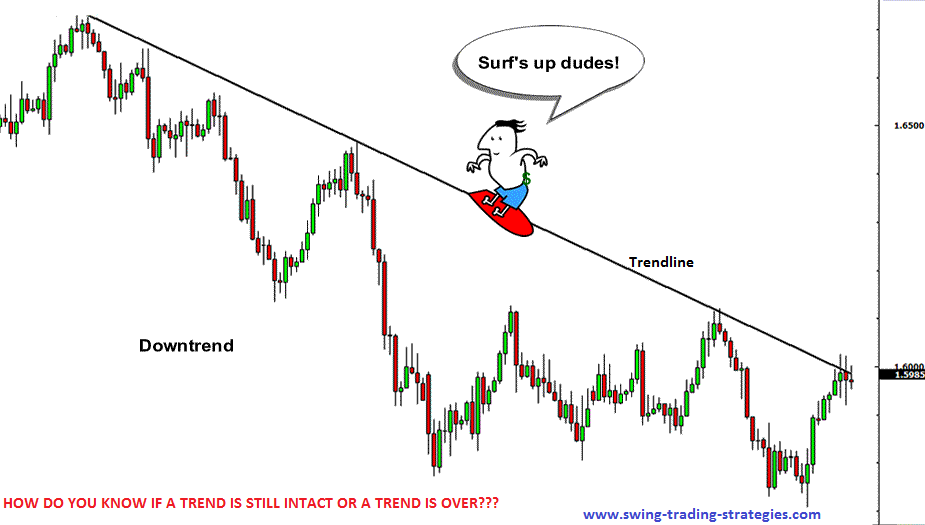
when a market is trending nicely, you will notice price makes peaks and valleys like the chart shown below.
- these peaks and valleys are called price swings.
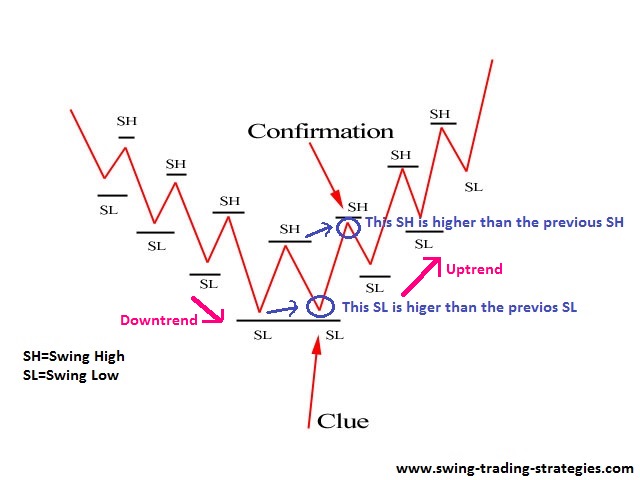
- if a market is trendine up, what you will have is a pattern in increasing peaks and increasing valleys (in layman’s terms)
- if a market is trending down, what you will have is a pattern of decreasing peaks and decreasing valleys.
- at any time, this pattern is broken, there is possibility that the trend may be changing. Notice that I used the word “possibility” here.
WHAT IS A TREND?
The definition of a trend: The movement of price over time whether up, down, or sideways is called a trend. Which means there are three types of trends:
- up trend
- down trend
- sideways trend
The chart below shows a trending market.
First is a downtrend then an uptrend.
WHERE IS THE CLUE TO INDICATE THAT THE MARKET CHANGED FROM DOWNTREND TO AN UPTREND?
Its pretty simple really:
- Notice that, as the price was in a downtrend, a Swing High (SH) was formed which was higher than the previous SH. But this alone is not a valid indication of trend change to upward trend yet…
- The next thing to wait and see if a Swing High (SH) would be formed which would be higher than the previous swing high.
Once these two clues are fulfilled there is great possibility that the trend has change to an upward trend.
HONESTLY, THE FOREX MARKET IS NOT A PERFECT WORLD…SO WHAT DOES THAT MEAN?
It means that the chart above is the most ideal, “perfect word” situation where everything just follows that pattern.
But you and I know that this is not going to happen all the time.
Sometimes you get knocked around trying to guess if a new market trend has started because the conditions are fulfilled for trend change but only to find out some time later that the forex market moves again in its original trend.
Such is the nature of the forex market, you will learn as trade it and though technical analysis is not a perfect science, it is more of an art to be quite honest.
How you may wonder…?
The answer is simple really: if it was a perfect science with its fixed laws, everybody would be millionaires a million times over because it would be like 1+1 (apply the fixed laws)=2 (guaranteed results).
What do you think?
POPULAR FOREX INDICATORS FOR TREND DETERMINATION
Not all people like using price action anyway, maybe including you.
But if you have read this far, I guess you are interested about price action (that’s good).
Now BTW: moving averages are notoriously popular with majority of forex traders worldwide. They are simple and does not need a lot of thinking to figure out how to use them.
If a price is moving above a moving average, then it is an uptrend. If price is moving below a moving average, then it is a downtrend.
The disadvantage of moving average is they are a lagging forex indicator-meaning, price will have moved a lot before you see changes on the moving average indicator.
Other trend indicators:
-MACD
-ADX
-RSI
Just google them and do your research on it if you want.
Thanks for stopping by this website.
PS:Did you enjoy this? It would mean the world to me if you shared it:
 Posted in