


The bullish pennant trading strategy is continuation strategy where you use one of the common Forex chart patterns called the bullish pennant to enter into a long trade.
It’s east to get confused with bullish pennant Forex chart pattern with the bull flag Forex chart pattern formation, they are different. I generally consider flags and any pennant pattern (any triangle pattern) as simple consolidations in price. I don’t trade them much differently.
The bullish pennant trading strategy is a pure 100% price action trading strategy. You don’t need a Forex indicator but you just need to develop the ability to spot this pattern. The only way to get good at spotting this pattern is through chart time.
There is also a bearish pennant chart pattern and you generally just flip whatever I am about to describe as you look for them in a downtrend.
DIFFERENCE BETWEEN A FLAG FOREX CHART PATTERN AND A PENNANT CHART PATTERN
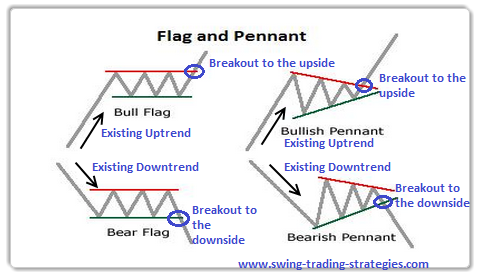
The difference between a pennant chart pattern and a flag pattern is that is that a flag pattern looks more rectangular shape (hence the name) where a pennant looks like a triangle.
You can see the difference between the patterns is subtle (they are not as easy to find as this graphic shows) but and the main this is not the converging trendlines when looking at the pennant.
PENNANT CHART PATTERN
The pennant chart pattern is a common chart pattern used in forex technical analysis and it is formed when you draw two converging trendlines as noted above
- For a bullish pennant chart pattern to form, there has to be an existing uptrend (higher highs and higher lows)
- For a bearish pennant chart pattern to form, there has to be an existing downtrend (lower highs and lower lows)
- The formation of a bullish pennant pattern shows a period of market consolidation
- A breakout of this bullish pennant chart formation should breakout to the upside continuing the original uptrend.
- The bullish pennant chart pattern is a bullish continuation pattern.
HOW TO TRADE THE BULLISH PENNANT-THE TRADING RULES
Timeframes to trade: 1 hr, 4 hr, and daily
These are the best timeframes to trade this chart pattern. You will find that most chart patterns are more reliable, have more traders interest, on the higher time frames.
- When an uptrend has started, you wait for the bullish pennant formation to form.
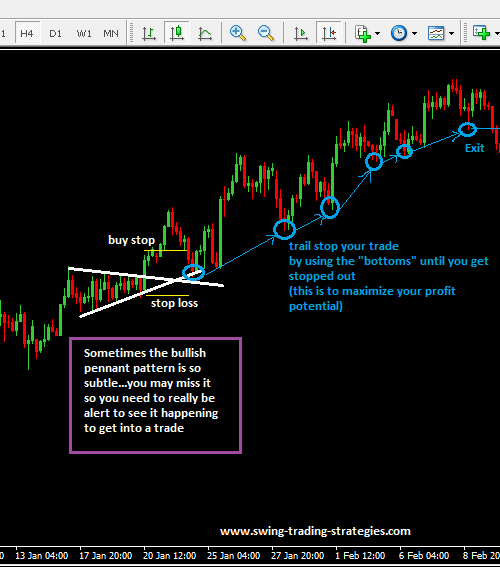
- You do this by drawing two converging trendlines and wait for price to breakout of the downward trendline (top line) to the upside.
- Once price breaks out to the upside, makes sure the candlestick must close outside of the downward trendline.
- Place a buy stop order 3-5 pips above the high of that candlestick that has just closed.
- For stop loss, place it 5-10 pips below the low of that candlestick.
- Set your take profit at 3 times what your risked or use a previous swing high point and set the price level of that as your take profit target level.
- How to manage your trade: as price continues to move upward, lock in your profits by moving stop loss and trailing it behind “bottoms” that form as price continues to move up.
While this pattern is a great way to get onboard a trend, be on alert for increased volitility if price gets too deep into the apex formed by the converging trendlines.
ADVANTAGES OF TRADING THE BULLISH PENNANT FOREX CHART
- 100% Price Action Trading Based only on Price Action
- If you’ve missed an uptrend from the beginning, the bullish pennant trading strategy, since it’s a continuation pattern, allows you to get in along the way.
- In a strong trending market, you will have quite a few instances to get involved with the trend using this Forex strategy.
- The bullish pennant Forex chart pattern does occur regularly in all timeframes.
THE BAD
- Forex Technical Analysis Using Price Action Trading Is good but they will not give you 100% trading success rate (no Forex trading strategy can give you a 100% rate)
- The breakout to the upside can result in a very long candlestick which means that your stop loss may be quite large so you have to decide to take this kind of trade or let it pass by or reduce the size of your contracts you trade.
- If you are not paying attention or not really focused on looking for this chart pattern, you may miss it because it does take a little bit of skill to identify it and trade it succesfully.
 Posted in