


This is one simple but very powerful false breakout forex trading strategy that can be used on horizontal support and resistance levels when price makes a breakout of the level only to fail later.
By the way, you may also be interested in reading these:
- price action trading secrets & tricks
- forex trading strategies that work
- best trading trading strategy for capturing insane amounts of pips.
- top 10 candlestick patterns
- you want to survive forex trading, you need to read forex trading risk management techniques.
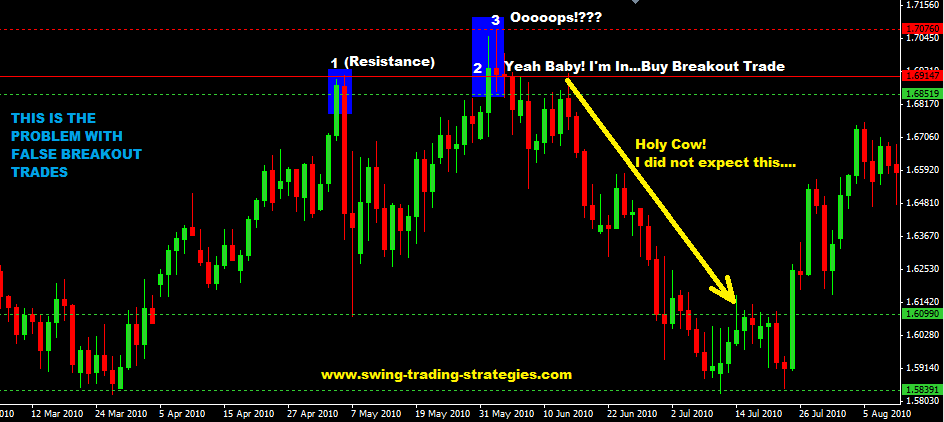
The following chart below would make this situation a bit more clearer for a situation where you’d be waiting to buy the breakout of a resistance level and what happens just after you’ve got into a trade:
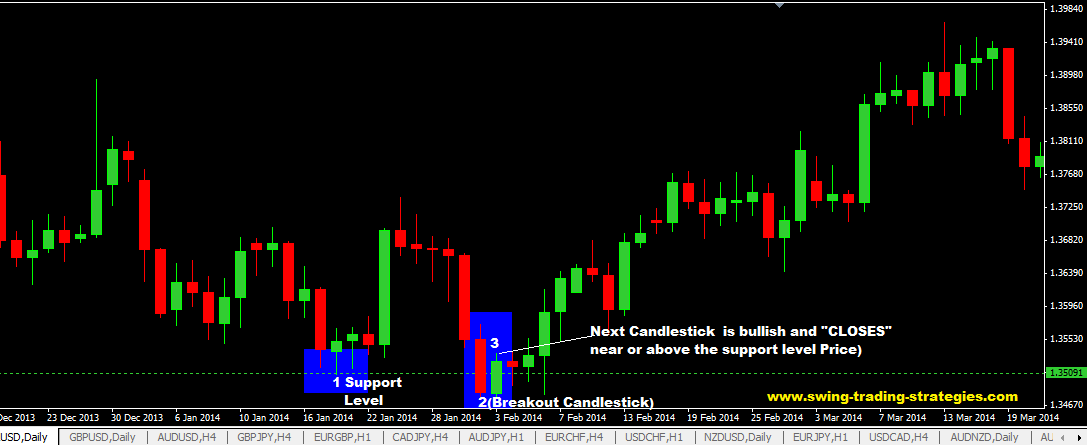
And this would be the situation when you sell on the breakout of a support level and what happens just afterwards:
So do you see and understand how kind of false breakout trades become traps for many forex traders?
And this is what happens:
- You trade the breakout of a support or resistance level and the breakout happens as planned
- but than soon after the breakout happens, the market goes the other way on the 2nd candlestick after the breakout.
- All the market did was to breakout as you anticipated and triggering your pending order and you are smiling but on the next candle the market goes the opposite direction and closes within or around the level of support or resistance…thus wiping the grin off your face because now you either have a floating loss or your profits have been eaten away and reduced or you have been stopped out.
These are examples of a false breakout on horizontal support and resistance levels.
So what you need is to know what kind of breakout chart pattern you to look for when there is a false breakout.
- Now, usually when this false breakout happens, its a very good signal that the market will head in the other direction.
- So if you’ve had your initial breakout trade stopped out, don’t walk away…
- you can trade this false breakout using a false breakout pattern I’m going to show you here.
THESE ARE THE STEPS TO IDENTIFY THE THE BREAKOUT CHART PATTERNS
For Short Trade Setups (refer to the first chart above):
- First, the market must be in an uptrend which means prices will be making higher highs.
- These higher highs are in fact acting as resistance levels and you need to identify and know them because in the process of price going higher it would usually pullback down and then head up again breaking the nearest higher high to create another new higher high.
- Wait for the breakout to happen. Ideally, the breakout candlestick should close above the resistance level thus making it look like a genuine breakout.
- But the 2nd candlestick after the breakout should be a bearish or very bearish reversal candlestick pattern and it should ideally close near or just below the resistance level it just broke.
For LongTrade Setups (refer to the 2nd chart above):
- First, the market must be in a downtrend which means prices will be making lower lows.
- These lower lows are in fact acting as support levels and you need to identify and know them because in the process of price going lower it would usually rally back up temporarily and then head down again breaking the nearest lower lows to create another new lower low.
- Wait for the breakout to happen. Ideally, the breakout candlestick should close below the support level thus making it look like a genuine breakout.
- But the 2nd candlestick after the breakout should be a bullish or very bullish reversal candlestick pattern and it should ideally close near or just above the resistance level it just broke.
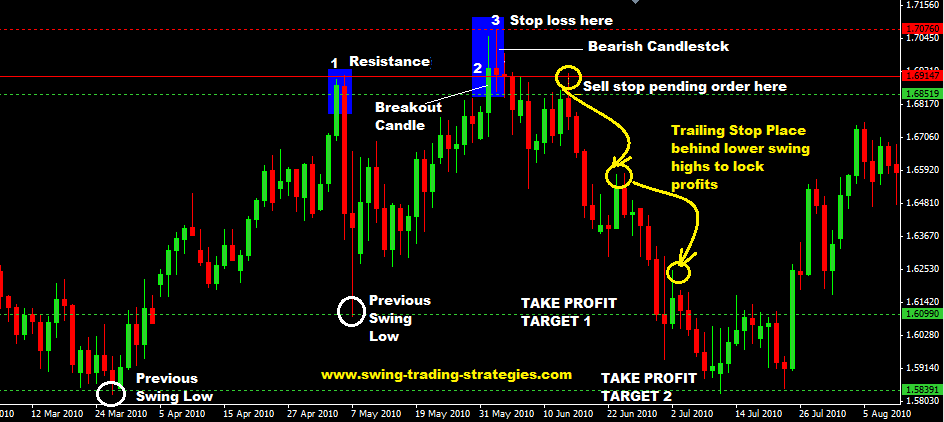
THE TRADING RULES FOR FALSE BREAKOUT TRADE
For Short Trade Setup:
- Place a sell stop pending order 2-3 pips below the low of the bearish candlestick.
- Your stop loss should be 3-5 pips above the high of that bearish candlestick
- Use Previous swing lows as your Take Profit 1, Take Profit 2 levels etc
Trail your stop loss behind lower swing highs and lock in your profits as the trade goes profitable.
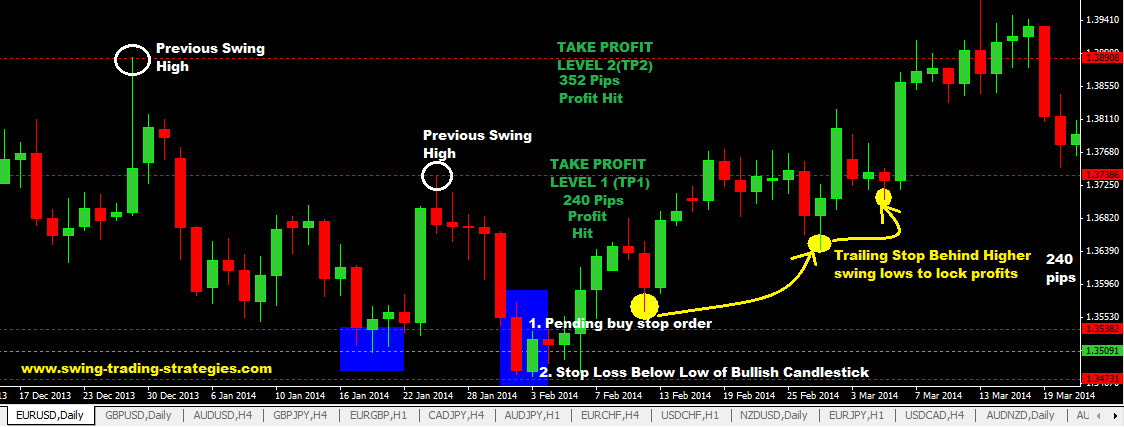
For Long Trade Setup:
- Place a buy stop pending order 2-3 pips above the high of the bullish candlestick.
- Your stop loss should be 3-5 pips below the low of that bullish candlestick
- Use Previous swing highs as your Take Profit 1, Take Profit 2 levels etc
Trail stop your stop loss behind higher swing lows and lock in your profits as the trade goes profitable.
ADVANTAGES OF TRADING THIS FALSE BREAKOUT FOREX TRADING STRATEGY
- The market trend generated by this false breakout chart pattern tend to go on for a very long time which can allow you to get hundreds of pips in that trend when you are trading in larger time frames like the 4hr and the daily charts.
- Nothing complicated, its just price action trading in action and the rules are fairly simple for even beginner forex traders to understand.
- the risk to reward ratio of the false breakout forex trading strategy is really excellent. Imagine risking say 40 pips for a 240 pips profit? This forex trading strategy is capable of doing that.
DISADVANTAGES OF THE FALSE BREAKOUT FOREX TRADING STRATEGY
- I guess the difficult part for me sometimes is I will be so focused on watching other chart patterns that when the false breakout chart pattern happens I will not realize it until later and wonder why there was a breakout and then the price moved away from a particular support or resistance level …out of curiosity I will check to see why…only to discover I missed that false breakout trade signal. You really have to be paying close attention to see if these false breakout chart patterns are forming for you to take the trades, otherwise you will miss these false breakout signals.
- As usual, there will be times when the false breakout signal will be actually false…which means you will suffer a loss even though the trading setup was perfect. As an example, there might be a price spike on the 3 candlestick after the breakout which can knock out your stop loss. Or there will be false breakout signal and you will get into a trade and then a few candlesticks later the real breakout happens! Such is the nature of the forex market.
You may be also interested in the support and resistance forex trading strategy. (click that link)Its similar it setup to the false breakout trading forex trading strategy but the only difference is the fast breakout candlestick that happens.
Could you please share this post if you enjoyed learning something here by clicking those tweet, like and share buttons below? Thanks In Advance!
 Posted in