


Hello Traders,
here are some good forex trading signals to watch for the coming week. They are based on trendlines and support and resistance levels as usual and its all about price action trading.
Also remember that there lines can get broken and may not necessarily happen the way anticipated in the technical analysis which means you may suffer a loss.
However, if the trade goes as anticipated, you have the potential to make good profits because the risk:reward of these trade setups are really good.
Here they are:
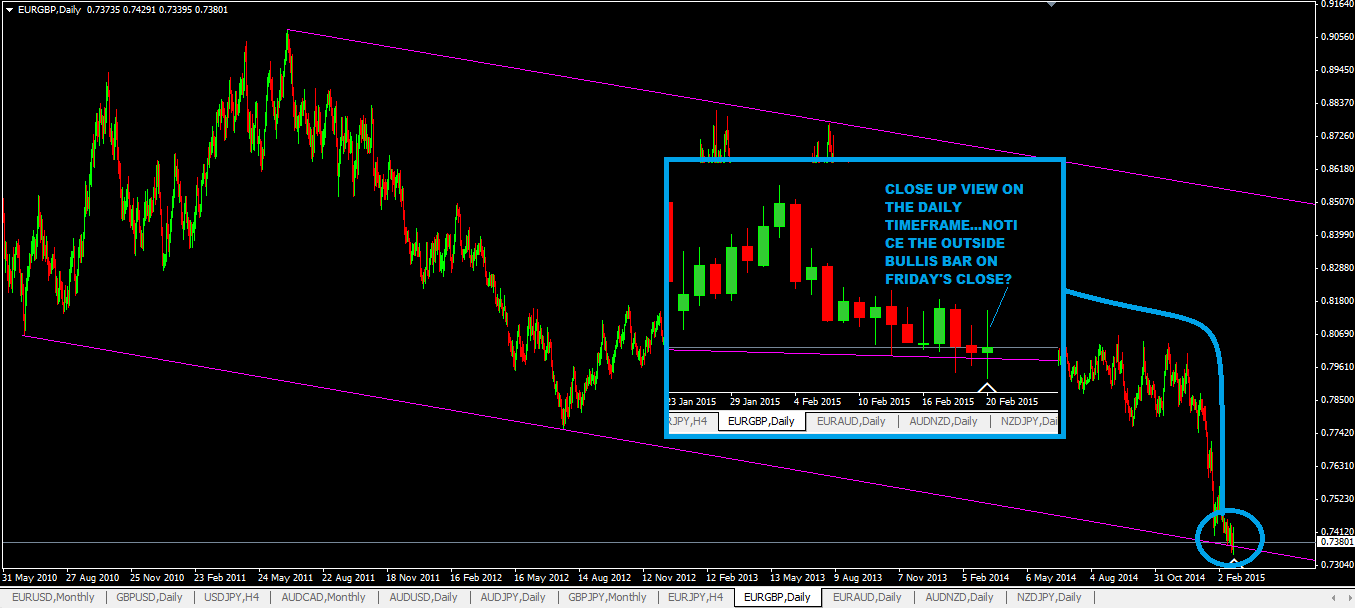
#1:Buy Forex Trading Signal On EURGBP
Price has hit the downward channel trendline already and you can see that there’s a bullish outside bar(candlestick) formed on Friday’s candlestick based on the daily timeframe.
You should switch down to smaller timeframes to look for a good place to enter. You stop loss should be placed a few pips under Friday’s candlestick close.
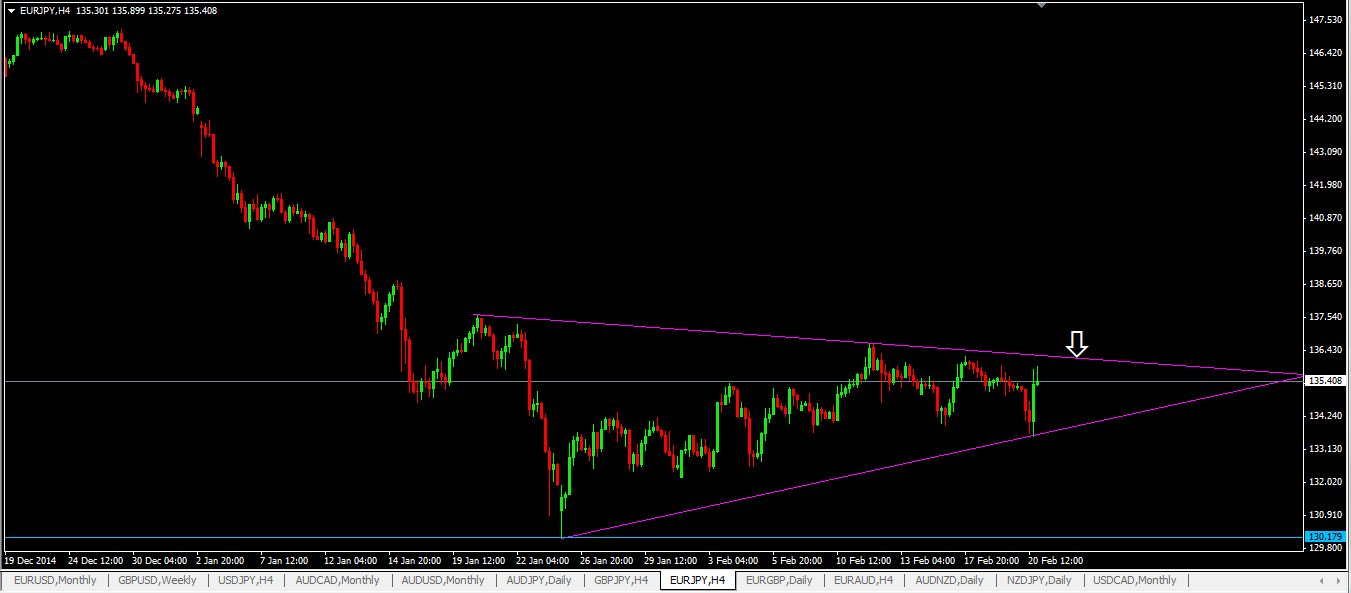
#2: Sell Forex Trading Signal On EURJPY
This sell setup is happening in the 4hr timeframe. Notice that there’s a symmetrical trial formation happening here. Notice also that the trend has been down for some time before this symmetrical triangle pattern formed and because of that, you should be looking to sell if price hits the upper trendline (and price is quite close it it) when you see a bearish reversal candlestick pattern.
The support level shown by the blue line can be used as your take profit target.
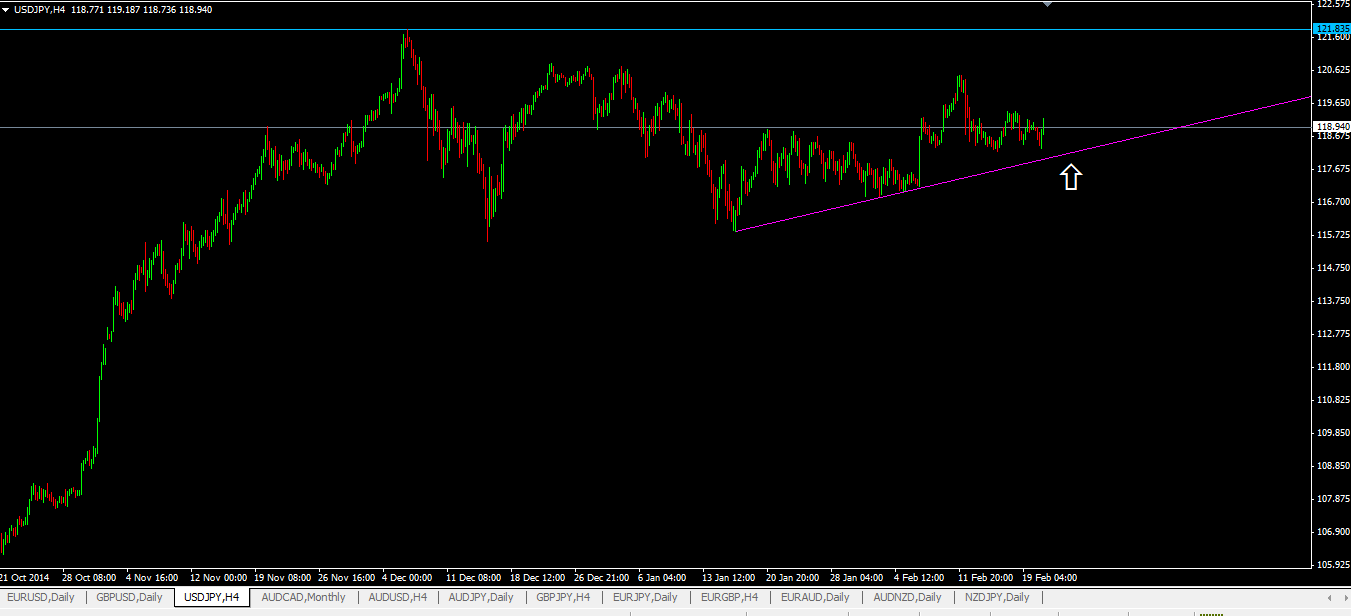
#3: Buy Forex Trading Signal On USDJPY
This trading setup is also happening in the 4hr timeframe. Just observe and see if price is going to come down and hit the upward trendline. If it does so, it may present a good buying opportunity if you see a bullish reversal candlestick pattern. The blue resistance level indicated by the line there can be used as a take profit target level.
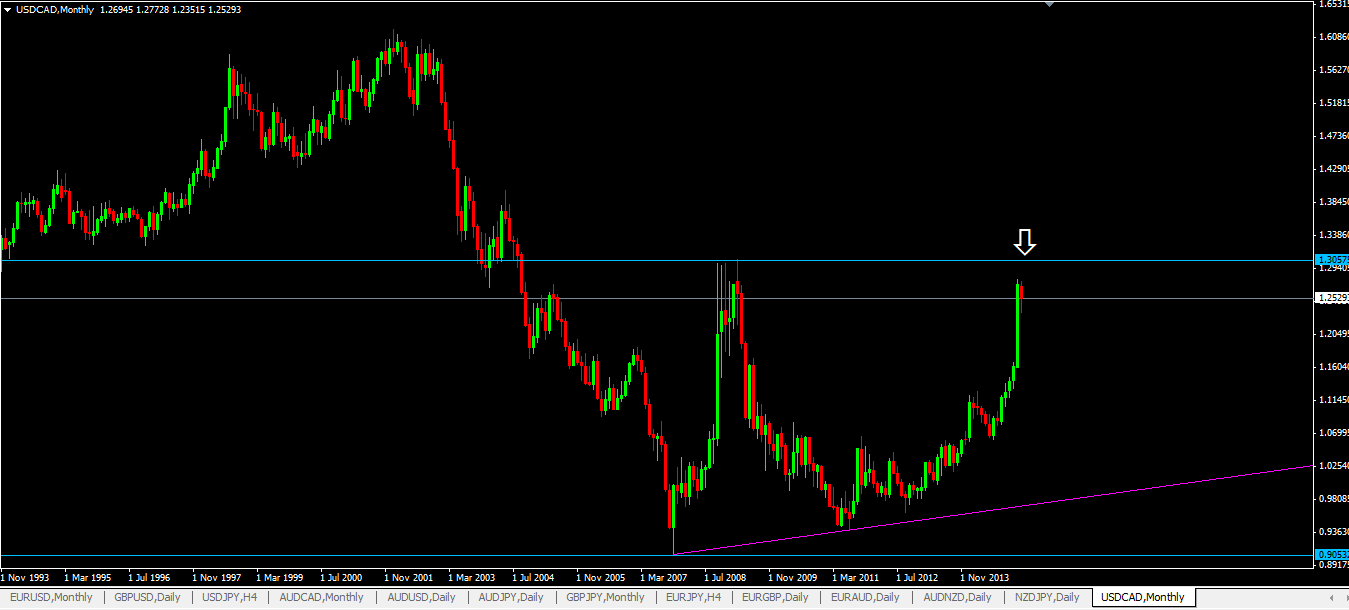
#4: Sell Forex Trading Signal On USDCAD
Ok, for usdcad here, the setup is based on the monthly timeframe and its still a long way away from happening but this is something worth keeping at the back of your mind so you can continue to check each week or so the see where price is at in terms of reaching the resistance level indicated by the blue line.
If price hits that resistance level, see if there’s a bearish reversal candlestick and short it. Your stop loss should be placed a few pips above that resistance line.
HOW TO TRADE THESE SETUPS
- if a trade is based on the larger timeframe, switch to a smaller timeframe to look for better trade entries.
- stop loss should be placed above resistance levels or above the highs of the bearish reversal candlesticks which you used to enter a sell trade. Do the opposite for a buy trade, use support levels or lows of bullish reversal candlestick patterns.
- For take profit targets, use previous lows or support levels for a sell trade and use previous highs or resistance levels for a buy trade.
In terms of trying to switch to a smaller timeframe for better trade entries, the following trading ideas & techniques can be adapted or varied to each situation so you can get a better trade entry at a much smaller timeframe:
DON’T FORGET!
Please don’t forget to tweet and share by clicking those buttons below.
Thanks
 Posted in
Am really glad your forex analysis is better than your jokes!
heh heh! thanks mate!