


Trading end of day charts for swing traders can be a great way to free up your day and still take part in the big moves.
In Forex, it may be a little difficult as it is a 24 hour market but there are times in Forex where volatility dries up. If you are swing trading Forex, think of entering your positions at the New York session close.
You may have to edit your candlestick closing time (if possible) to have a snapshot on how they day played out.
Remember that the market does basically 3 things:
- Price mean reverts – pulls back from the dominant swing
- Consolidates – stops putting in the price action trending patterns
- Moves with momentum
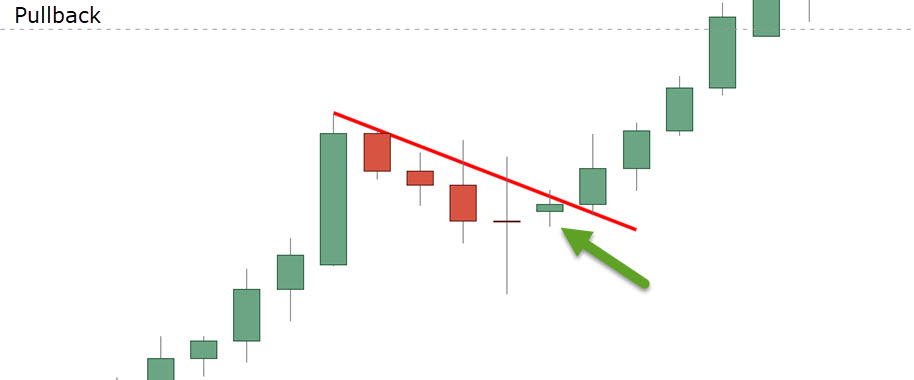
If you are trading pullbacks on an end of day play, it is fairly easy to see if price action confirms that the pullback, at least at that point, is complete and price is resuming trend. Even an inside day pattern as indicated in this graphic can enable you to get involved in the resumption of trend.
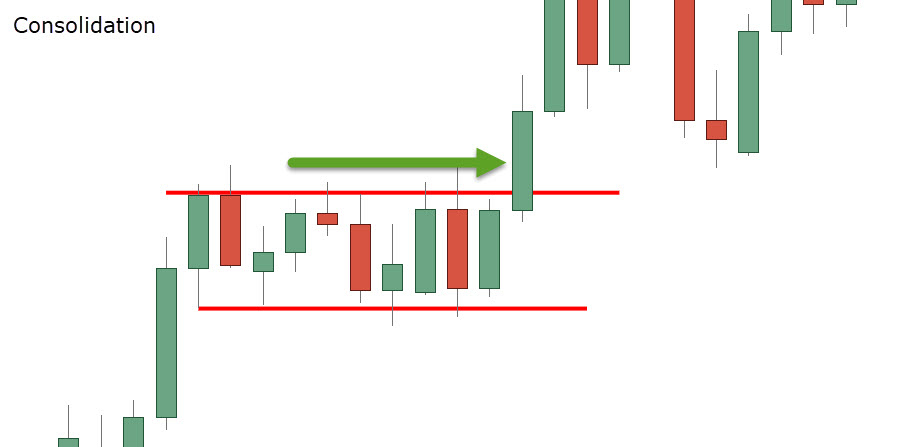
Trading Consolidated Breakouts
Even the end of day candlestick can show you the breakout of consolidation and if that breakout has some strength to it. This will enable you to simply enter with a market order or in this case you can buy stop the high of the breakout candlestick.
There are other ways to trade breakouts from consolidation but would require you to look at smaller time frame charts for multiple time frame analysis for the most part.
Trading Momentum Moves Can Be A Problem
Momentum moves pose a slight problem. Far too many traders wait to get into a price move and when they look at momentum, traders often times buy the highs before a turn in price. After a multi day run of momentum, it is often a safe bet to wait until there is a reaction in the opposite direction of price.
However, if you were to drop down to a lower time frame for the momentum trades, you can place yourself in position to take advantage of the momentum that comes the next day. You will also be taking advantage of price action that indicates there is potential for another move higher as opposed to flipping a coin and just joining momentum.
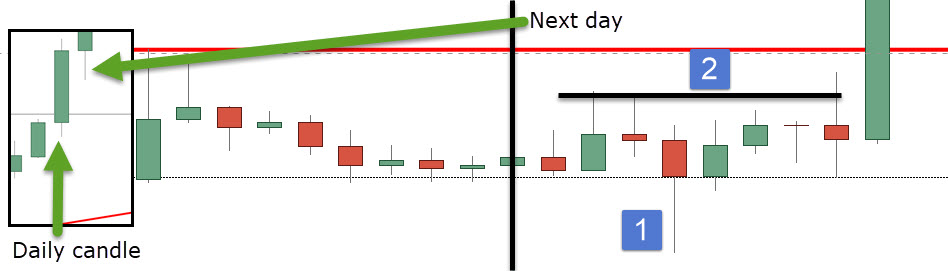
This graphic shows two days of price action. On the left is the daily chart and you can see the momentum candlestick that we are interested in. The problem is all we have is the candlestick but really no context.
To trade it would be a coin toss.
Look to the next candlestick and you can see a lower shadow. That lower shadow represents a pullback on the lower time frames.
If you are able to drop down to a lower time frame to look for price action and structure that hints to continued momentum, you may want to do it.
On the right is the inside of the second daily candlestick.
- Price was tracking sideways and we have a poke below support and bulls stepped in. This is called a “spring” or failure test pattern and is one of my favorite trading plays. This show intent on behalf of the buyers and you could either market in or simply buy stop the high. Doing so gives you a 40 pip better entry than simply buying the close of the previous day
- Assume you missed the first entry but understood the meaning of the failure test. You may opt to enter here at the basing that is setting up prior to the break of the previous day high.
Either one of these entries will allow you to take advantage of momentum as well as a bigger position size because you know exactly where the failure of momentum is.
If price breaks below the consolidation especially after the failure test move, you know that momentum is not as strong as it should be for higher probability trading. You may want to stand aside and wait for better price action.
Higher Probability Momentum Swing Trading
Using this trading technique with momentum candlesticks can put the odds in your favor as you are getting inside the candlesticks. Seeing forming price action and structure that points to continued momentum can allow you to lessen your losing trades and position size larger.
You will still loose regardless of the swing trading strategy you use but anything we can do to put the odds on our side is worth a shot.
If you liked this article, please do me a favor by sharing it!
I also found this great trade tracking sheet that helps you see if your trading is really making you money. It’s free!
 Posted in