


These types of images where a trading chart is cluttered with indicators always makes me laugh. There is so much information going on and no doubt one will conflict with the other.
Some will say more information the better. Depends on the quality of information as well as the source.
TIME TO SIMPLIFY
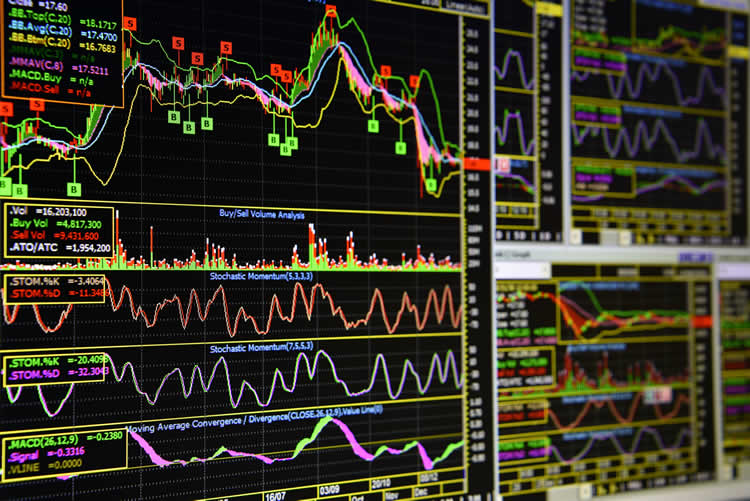
Look at what is on the chart in terms of indicators. On the main screen it looks to be some type of bands….could be Bollinger bands given the Bollinger “balloon that happens near the far right edge. There are certainly buy and sell markings which would indicate that it’s a 100% mechanical trading system. They may have some discretionary aspects to it but at face value, mechanical.
There is also overlap in when looking in the bottom panels. Except for the volume analysis, there are 2 momentum indicators and one has 2 settings given 3 levels of information in regards to momentum. The difference is that the stochastic may be used as an oversold/overbought indicator and the MACD is the true momentum indicator.
The truth with indicators as discussed is that they require price in order to calculate which means they are going to lead price. Someone skilled in price action trading could look at the chart and get roughly the same type of information.
- You can see momentum on the chart.
- You can see when a market is overbought or oversold.
You really don’t need a trading indicator to show you that.
Keep Your Trading Chart Simple
Indicators are not totally useless on a trading chart though. They can make great tools in terms of scanning or as a “second opinion” about what you are seeing or saw. You just want to make sure you are using the bare minimum and the use of the indicator has been shown to IMPROVE your trading. Something that does not add to your trading system is not worth having on the chart.
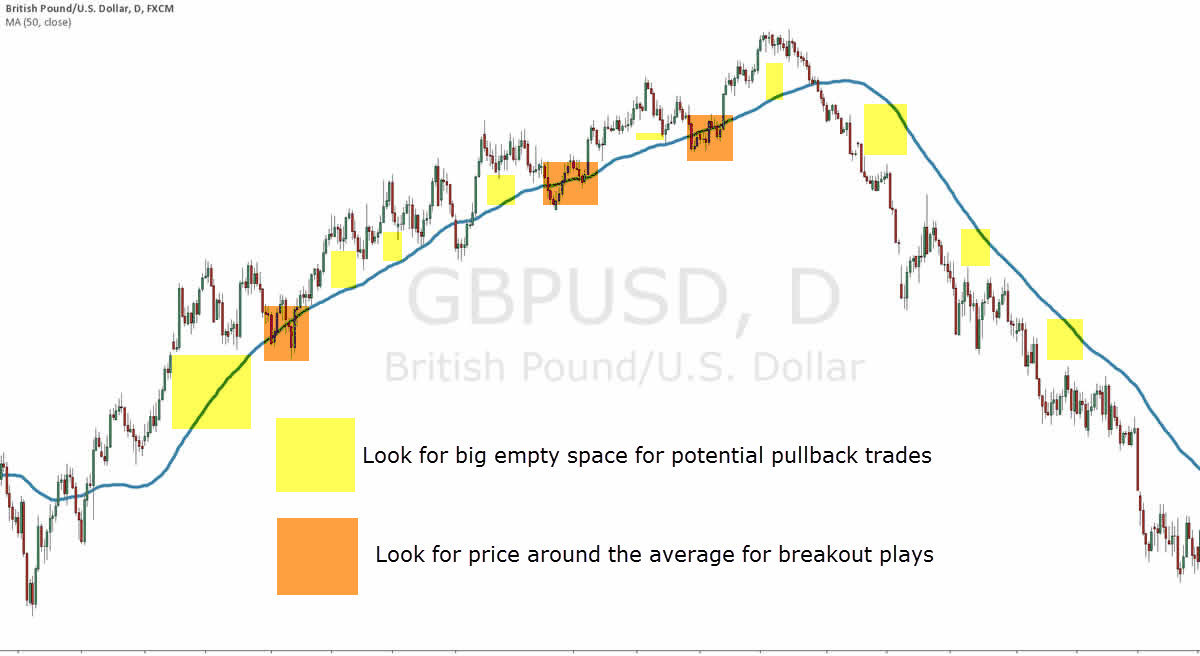
Trading Chart with 50 SMA
Let’s say you have a basket of charts you scan through and you are looking for trending market. You plot a 50 sma on your charts and look for price that is far away from the average (define what far is to you). Like the stretched rubber band, you anticipate a pullback trade and you put charts that fit your definition on a watch list.
You can quickly flip through charts and then flag the ones of interest for a second look at price. Each chart should take about 2 seconds.
What about scanning for breakout trades?
You can quickly scan for charts that have price hugging the moving average. Get drawing your support and resistance lines, either diagonal or horizontal, and play breakouts depending on your trade trigger.
Trading indicators are not all that bad but it really depends on how they are used. To be honest, most people use them as the holy grail and that’s not true!
Before you put another indicator on your trading chart, you can actually download a free indicator blueprint here that really tells you the truth about indicators.
 Posted in