


I know I may take some heat for going after the trend direction indicator as a useful technical analysis tool but the fact is that they can do more harm than good for most traders.
Indicators get a bad rap and the reason is not so much in the indicator themselves…but in how traders use them.
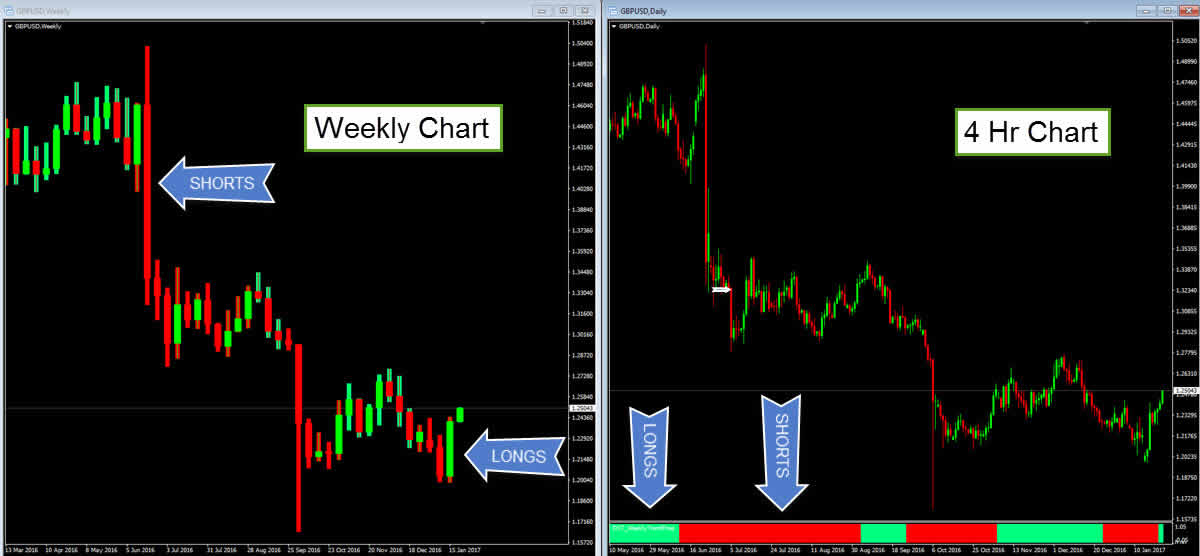
Trend Direction Indicators Have You Miss The Big Picture
Because most traders get handcuffed by the indicator and fail to see what price is really doing. Before I go on, I know some people are never going to give them up so here is a trend indicator for mt4 that you can download and use for free. Just apply it to your weekly or 4 hour MT4 charts if you are day trading according to the installation video and you will see how it works.
Trend Indicator Download For MT4
It’s no shock to learn that since indicators are a derivative of price (or volume) they are going to be lagging behind the movement of price. Depending on your settings, especially the look-back period, you may be a little behind the turn if using a short period or be miles behind. Also keep in mind that Forex does not trade through an exchange so getting a valid volume number is impossible.
If you are only keeping your eyes on the indicator, you are missing the story that price is telling you. Price will clue you in to a change in direction long before any trend indicator will.
Forex Technical Analysis Tools That Most Traders Use For Trend
No doubt one of the most popular tool used today is the moving average not only to identify zones where a short term trend reversal may take place (as in trading pullbacks – but there is no magic there) but also as trend direction indicator.
What is the most popular? Usually the 50 period, the 100 sma, the 200 sma and the 20 sma. You could swap out the sma for an ema but it makes little difference.
The question I hope you are asking is “what is so special about those numbers”?
Good question!!
There is nothing special except the bigger ones will be further away from current price which will lag the turns much more.
Of course there are others including CCI, MACD, Stochs and other trading indicators so out of all them, is one of them ranked as the best trend indicator? Since they all depend on some mathematical calculation of the same initial input (price) there is not one that is better than the others.
They all have the same drawback…they lag the actual price movement!
Can Candlestick Patterns Be A Trend Indicator?
There is some school of thought that an individual candlestick can help define the current trend or trend reversal. I am going to generalize here but it depends on where they form on the chart and what pattern candlestick we are looking at.
Where I take notice are candlesticks that are out of the ordinary from recent price action. For example, if this bearish engulfing candlestick takes place at a prominent resistance zone, could that suggest long before an indicator does, that a new trend direction is occurring?
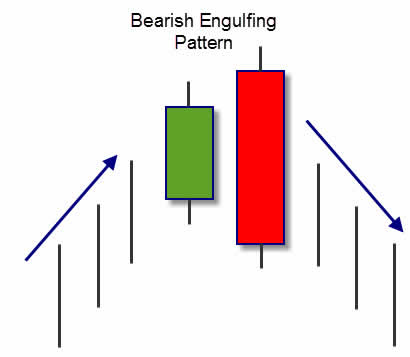
Bearish Engulfing
It certainly can be considered a trend reversal candlestick pattern due to location (even though it’s only 2 candles) and it can range from a short term trend move to putting in a top in whatever currency pair you are looking at.
While a moving average or any other indicator is still indicating long trades, I’d be looking for a position short. You can bet that if there was a support zone close by, traders that look at lagging price indicators may look to take a long on a pattern like a pin bar or inside bar.
And that is how a trend indicator can help drain your trading account if you only focus on the indicator. It can draw your eyes away from what is really important.
PRICE!
Moving Average Indicator Sets You Up On Wrong Side Of Price
This may not be the best example but it gets the point home of using price and context.
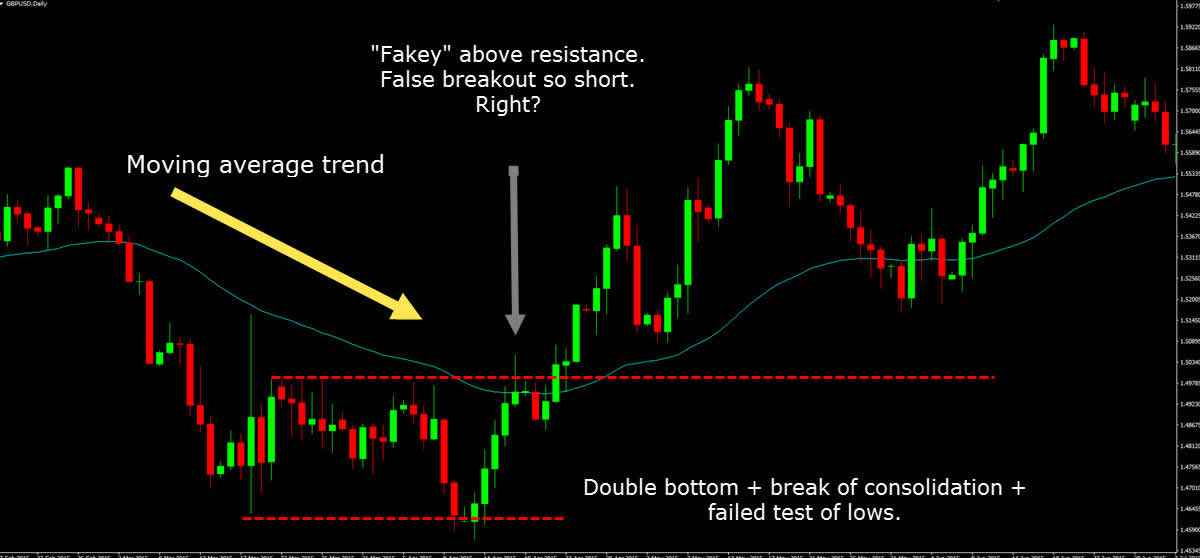
50 SMA Trend Indicator
You can see that price was telling a story long before that short trade set up. The bear candle after entry would have late traders jumping into what they deemed to be a move down. You can see momentum in that candles as it closed on the low of the session so you KNOW traders looked to short in the “trend direction” of short.
And they lost.
Moving average are not all bad though. Simply due to their calculations, you can see when a market is actually trending or consolidating. Make no mistake…there is no magic in those pullback trades after the upside turn. If you think about how the calculations work, you can fully understand why it can not only show a turn but also meet price at points on the chart.
- Price turns from negative to positive and turns the indicator.
- Price pushes to the upside giving a higher average price so indicator rises.
- Price pulls back at times with momentum and then consolidates.
- Moving average calculates a lower average…..meets price.
You can use a moving average as a quick scan however to see if you are looking at a chart that is moving or one that is consolidating.
Use Price Action and Patterns as Your Trend Direction Indicator
Price always tells a story and sometimes the story can be a little confusing. If it is, pick another chart. Indicators can smooth out the volatile price movements so you think you are looking at a calm chart but the reality is it’s a chart with no clear direction full of spikes back and forth.
Trading that environment will wipe you out.
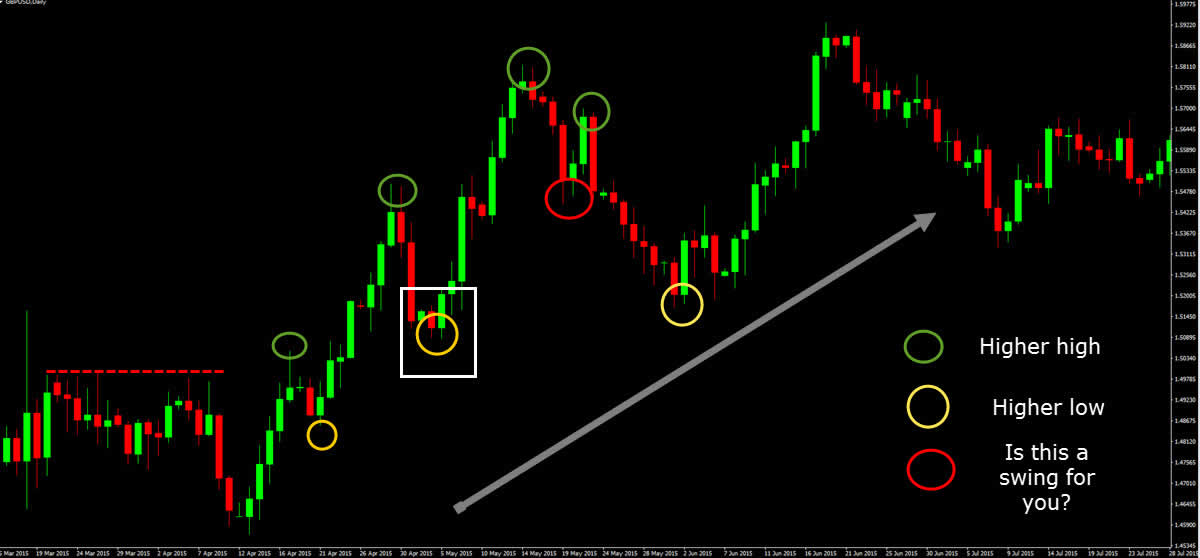
Seeing momentum candles in one direction along with weaker candles in the opposite direction can be a great indicator of the current trend of price. We also can never forget the standard higher high and higher low for an uptrend and lower highs and lows for a downtrend either.
My general rule is that, as you can see on this chart with the red circle, we must see a true swing and that’s something you have to decide. Regardless, due to the strong up trend that happened after the higher low, the area with the white box, if broken, would signal to me a true trend change.
Market Structure As Trend Direction Indicator
You want to help save your account? Learn some price acting trading strategies (which are really great for swing trading) from my free course and learn to listen to what the chart is telling you.
 Posted in