


Trading with only trend lines is a swing trading strategy that virtually any trader can learn.
There is no tweaking indicator settings, deciding which technical indicator to use, or is there any special candlestick pattern that you need to learn.
The only thing you need to know is how to draw trend lines which is easy enough to learn although it can be a little subjective in terms of which swings to use.
I want to show you a simple trend line trading strategy that you can start back testing today to see if it “fits” you as a trader.
Trading With Trend Lines Strategy
The Trendline Breakout Swing Trading Strategy is a very reliable swing trading strategy that is really straight forward and easy to understand and use.
As mentioned earlier, this is a trend lines only trading strategy so you first must learn how to draw a trend line.
Sounds simple enough, right?
It is as long as you stay consistent in how you are drawing them.
Wait. How Do You Draw A Trend Line?
- For a downward trend line, you connect a minimum of two lower swing highs.
- For an upward trend line, you connect at least two higher swing lows and you would have an upward trend line.
When price breaks a trend line, it is usually an early signal that a trend may be changing. So a trade will wait for the candlestick to close below or above a trend line to place an order.
But there are a few nuances to trend lines as you can see in this chart
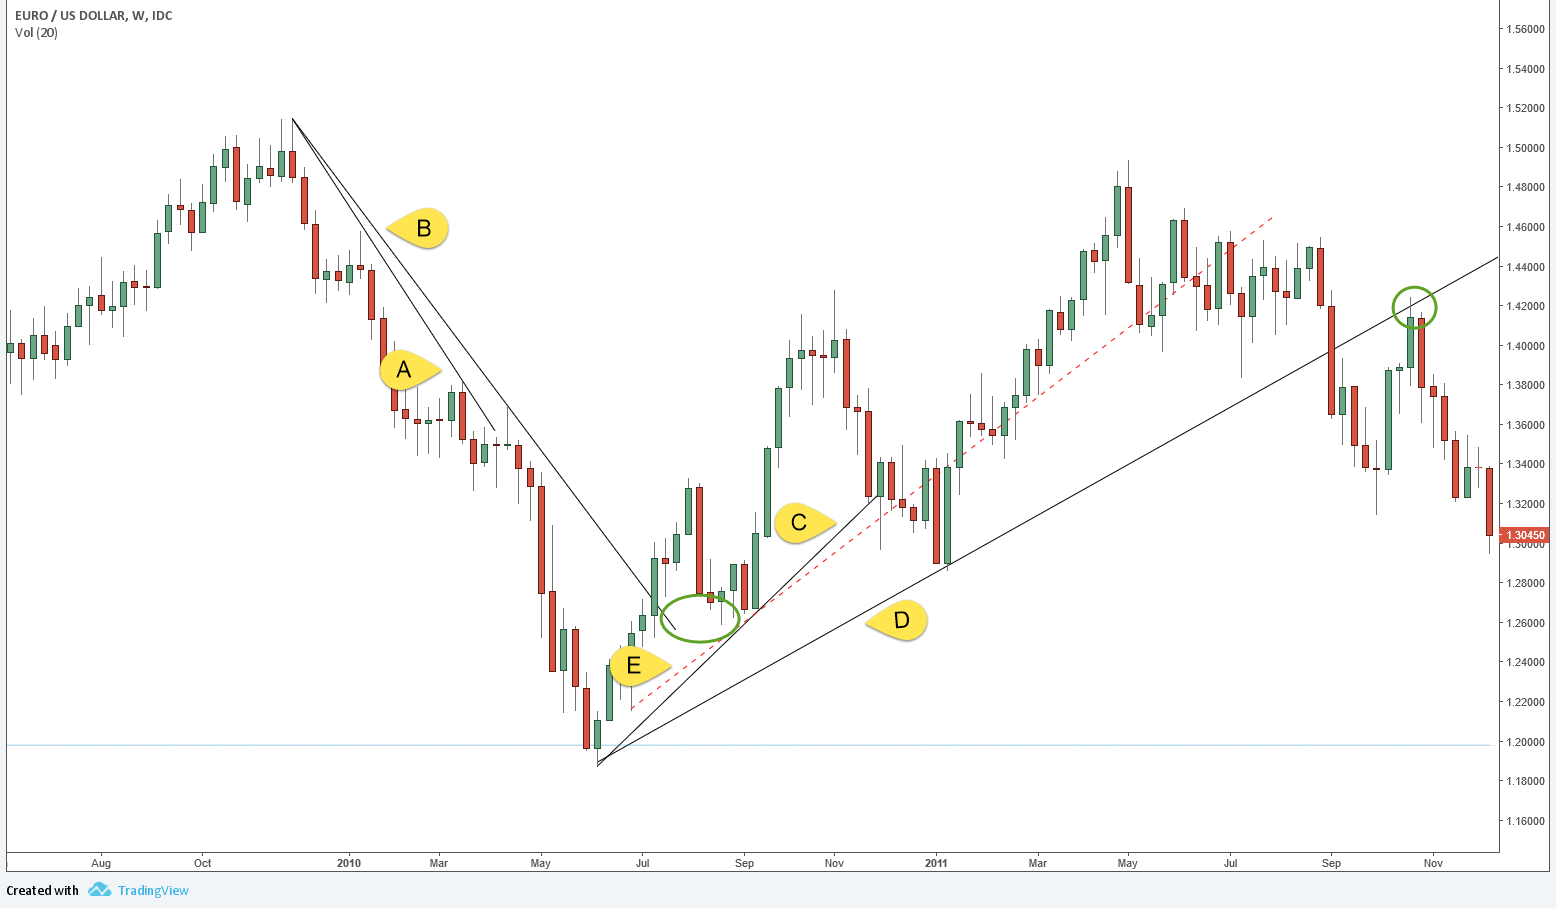
A. This is the original trend line in the down trend. You can see that price breaks the trend line but reverses and breaks lows. I can redraw the trend line (known as fanning) to take into account the new price action.
B. This is the fanned trend line in the down trend. You can see at the green circle that price broke the trend line to the upside, reversed and tested the approximate trend line area before taking off to the upside. This is known as a trend line retest and is quite common with not only trend line breaks but also any breakouts plus support and resistance trading.
C. The is the original trend line in the uptrend. Note that price hesitated in the area and then broke to the downside. Price does recover and some traders may not draw a new trend line but price would simply hug the trend line in this example.
D. Is the fanned trend line taking into account the obvious turning point in the market. Also look left and you will see this pullback coincides with a previous rejection zone. Also look to the right of the chart and you will see that price used the backside of the trend line for resistance before dropping in value.
E. This is a special trend line known as an inner trend line. It doesn’t use the obvious swing level but looks to take advantage of either the last swing before the pivot low or a swing after the pivot low. I tend to use these more often as they will generally contain price inside the pivots and react long before a normal trend line bounce would occur.
Using Only A Trend Line Trading Method
We will not use any other technical indicator to trade with. A simple trend line is all we will use as well as price action around the area of the trend line. You should know what a reversal pattern looks like to help improve the odds of a winning trade.
- Time frame: Any but higher time frames generally give better results especially for swing trading strategies
- Currency pairs: Any but you may want to stick to the active major pairs
- When to trade: Since we are swing trading this strategy, you can check a few times a day. Once a day is enough if using the daily chart for trading signals.
Trading Rules For Long Trades
- Draw a downward trend line
- Wait for that trend line to be intersected and the intersecting candlestick to close above the trendline.
- Place your buy stop order 2-5 pips above that intersecting candlestick.
- Place your stop loss 2-5 pips below the low of that intersecting candlestick
- Exit when the opposite trendline is breached
Trading Rules For Short Trades
- Draw an upward trend line
- Wait for that trend line to be intersected and the intersecting candlestick to close below the trend line.
- Place your sell stop order 2-5 pips below that intersecting candlestick.
- Place your stop loss 2-5 pips above the high of that intersecting candlestick
- Exit when the opposite trend line is breached
See attached chart. (If you cant see it clearly, click to enlarge)

Trade Management
How you manage your trade will depend on what you are looking for in the market. Are you just trading one easy swing or are you looking to ride a trend “until it bends”?
- When your trade moves in your favor, trail stop your trade by locking in profits
- Use the swing points and place your stop loss behind them as price moves in your favor
- You can also use an ATR trailing stop as well as the ATR to set your initial stop loss
- Let your profits run and exit when an opposing trend line is broken
Whatever way you decide to trading this trend line strategy, make sure you are using a trading plan that outlines every aspect of your trade.
 Posted in