


A Renko trading chart looks like a candlestick chart with no wicks or tails and with each bar having the same size, high to low. For traders who’ve never traded a Renko trading strategy either in Forex trading, Futures or even Stocks, you may be a little confused as to how to trade them.
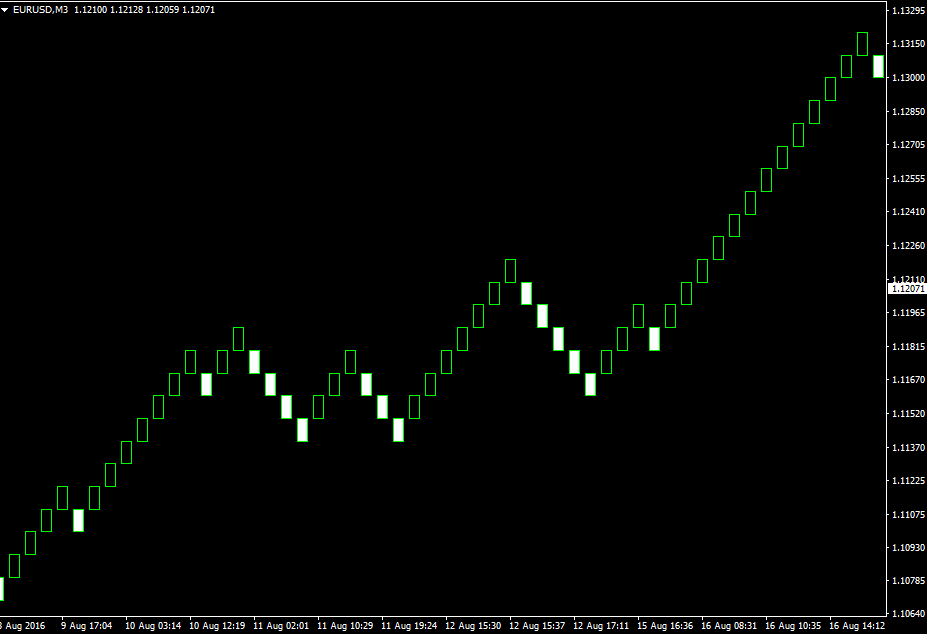
Figure 1
Renko bars are called various things, bricks and boxes, and each box size is the same depending on the setting the trader is using. You only see the open and close with these bricks so if you need a trading strategy that takes into account the days highs and lows, Renko trading may not be for you.
The consecutive bricks do not overlap and they are independent of the time frame you are using for any other strategy.
Thinking of the box size, a ten pip Renko chart will draw a new brick after price moves ten pips (Forex) above or ten pips below the last bar. That also means that price may move nine pips higher or nine pips lower than the last bar and still not complete a new brick. I
In effect there is up to a 28 pip price range before a new brick is drawn and that is something we need to keep in mind when placing our entries and stops.
Keep in mind that price is still used and a Renko bar is simply another chart type that may or may not prove useful to you.
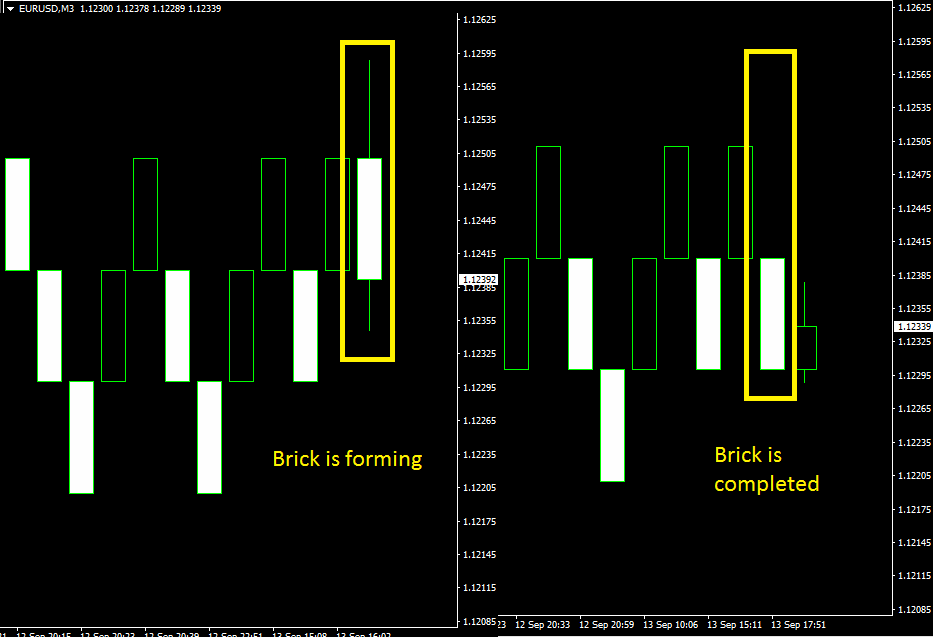
Figure 2
Figure 2 shows price movement prior to and after completion of a new brick. Notice that once the brick completes all prior price movement is hidden. We don’t see how high or how low price moved before the brick closed.
It should be mentioned that there are alternative versions of the Renko chart that will show the wicks but we will not cover those here.
Since the bricks are drawn based on price action it follows that these charts are also time independent. Depending on the market and size of the bricks it might take minutes, hours, or days for a single brick to be drawn.
You’ll need to experiment with the brick size to find one that gives you intervals that work for you.
KEY POINT: It is the brick size that matters with Renko bars. Time frame is not taken into consideration.
Renko Bars Cut Through Noise
Renko charts are great for swing trading as they give a clear indication of trends, devoid of noise. In an up trend or rally we have a series of hollow bricks, in a down trend or selloff a series of solid bricks as seen in Figure 3.
It’s always easy to detect pullbacks and resumption of trend in a Renko chart and consolidation areas are clearly delineated.
This feature of Renko can help cut down on the amount of subjective interpretation a trader will have when looking at a trading chart.
Less discretion = More consistency
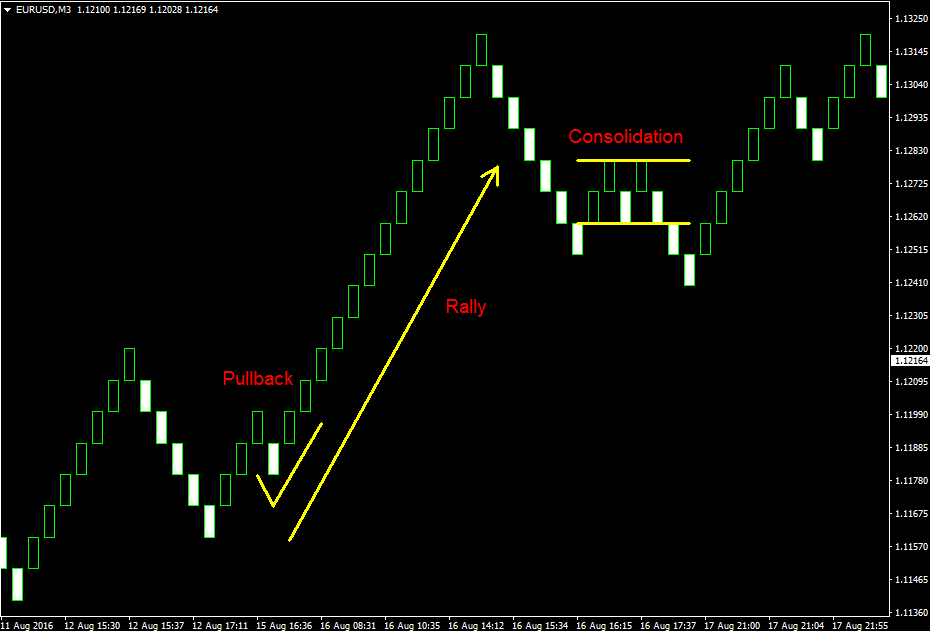
Figure 3
Renko Trading Strategy – Keep It Simple
You can add indicators to a Renko charts just as you would to any other chart type, but perhaps the best way to use them is also the simplest: using support/resistance and trend lines.
Figure 4 shows an example in the EURUSD. We’re using ten pip bricks in this example and the rectangle indicates a clear consolidation between 1.1200 and 1.1260. In this case we would wait for a new brick to close above or below the consolidation zone and then enter on the breakout.
It’s not very often you will see such defined support and resistance areas in consolidation but that is another plus to use Renko!
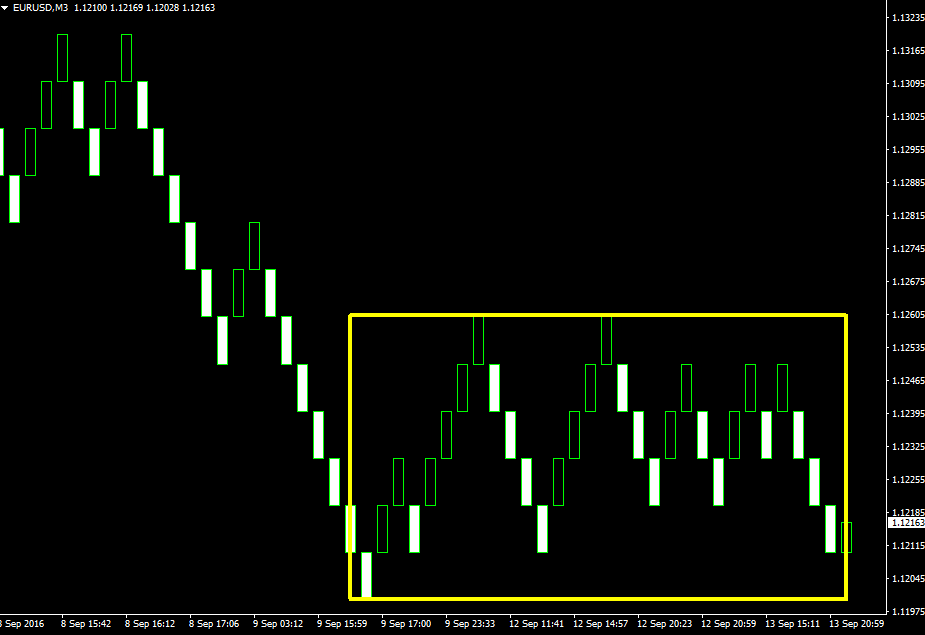
Figure 4
Renko Bars And Trend Lines
In Figure 5 we see a simple application of trend line breaks with Renko charts. Whenever a new brick closes above or below the trend line we enter a trade in the new direction. To avoid whiplashes we wait for a two brick break before entering the trade but we exit quickly on a single brick break.
You can see how clean the chart is and how all the noise is removed to give us easy and unambiguous entries and exits. In this example using ten pip bricks we booked two bricks (20 pips) of profit in the first leg, five bricks (50 pips) on the second and none on the third.
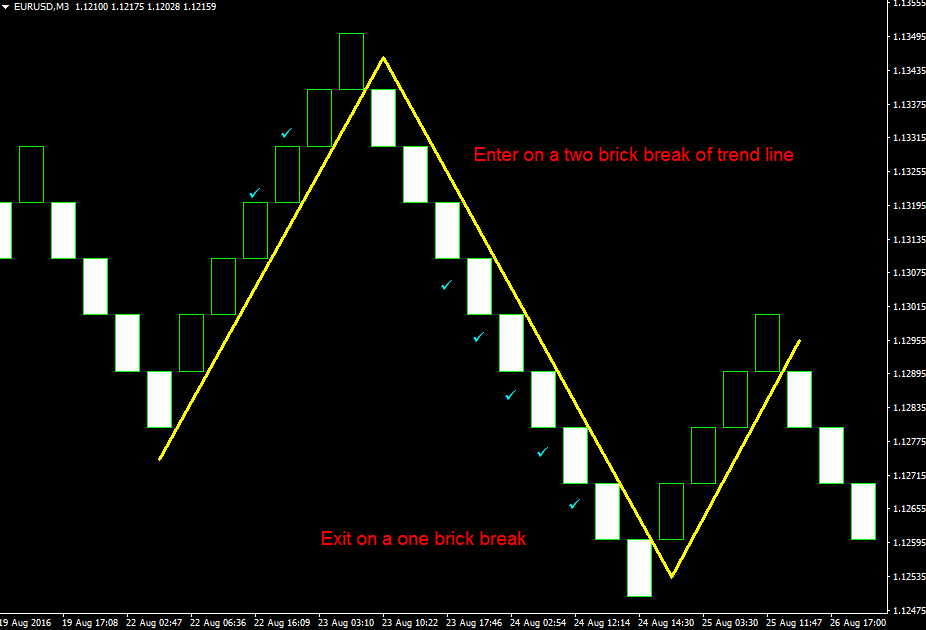
Figure 5
Quick And Simple Trend Direction
It’s also possible to use Renko charts simply to confirm the overall direction of the market while trading your current strategies. A 25 or 50 pip Renko size is good for swing traders. Figure 6 is a 50 pip Renko chart of the EURUSD and you can see how it would have kept you in the strong trending moves back in May and June and how we’ve been consolidating the past three months.
You may want to investigate using a multiple time frame approach where you trade the direction of the higher time frame trend on the lower time frames.
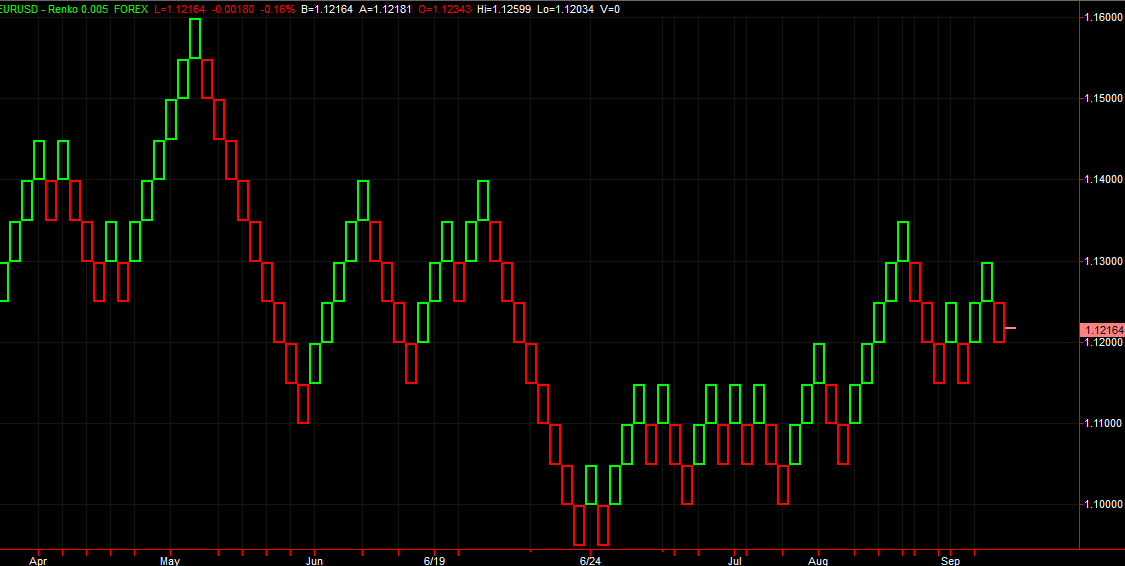
Figure 6
Renko Charts Are Not For Beginning Traders
They can be difficult to trade because of the relatively large price movement that can take place before a new brick is actually completed. You need to be patient and wait for the brick to close. I suggest you experiment and monitor them alongside your usual strategy.
Look for the trending moves, identify the consolidation boundaries and see how those insights could improve your current trading decisions.
Experiment also with the simple strategies for trading trends, reversals and breakouts with Renko charts. Once mastered Renko charts become a powerful tool for your trading toolbox.
I found this really great video about Renko Trading and it comes with a Metatrader plugin so you can use Renko on that platform!
Watch the video and download the Renko Metatrader plugin here.
 Posted in