


Regardless of the market you trade, trading the daily charts is a viable trading plan. If you take a moment and think about day trading, what is important?
The close of the price bar or candlestick, right?
For example, if I trade an hourly chart as a day trader and my trading strategy is a breakout, I would need to wait for the breakout of course…but also the close of the candlestick to confirm.
So in essence, the movement of price during the process of the candlestick forming on the chart holds little meaning.
If you think about a daily chart candlestick close, it encompasses the highs and lows of the trading day. It is a single structure that shows where control was during the day and ultimately, who won the battle.
When the candlestick closes on the daily chart, you know traders are holding positions over night either long or short depending on their conviction.
Not Everyone Can Trade The Daily Chart
Let’s face it, in a world of instant gratification, it’s very difficult for a trader to look at the higher time frame for setup.
- There is nothing for you to do during the trading day (except adjust stops at the open or close)
- It’s hard to see price movement during the day to capitalize on but you have to sit aside.
- You’re trade usually last day to weeks – sometimes months.
Not only that, the higher time frame requires a large stop loss placement and in instruments like the Forex market, you need to keep your stop a little further away from price than other markets. If Forex trading strategy is support and resistance trades, entering using a stop order and placing your stop loss beyond a pivot low could be triple digit pips.
I tell you though, if you have the the capital which will still allow a decent position size, you could be doing yourself a huge favor by getting out of the noise of intra-day trading and onto daily chart trading.
Daily Chart Trading System That’s Simple To Implement
Stop complicating your trading. Believe that how you manage a trade and how you exit holds more water than the entry.
“From what you are saying it sounds like you could make money consistently with a random entry as long as you have good exits and size your positions intelligently”. – Van Tharp – Read the rest here
For this trading system, we are going to use simple Fibonacci retracements and a momentum indicator to help get you into the trade. We are not buying into the “power” of Fib numbers but what we are doing is simply setting up some structure on the chart so you have some focus on the daily chart.
We are going to keep the trading indicators to a minimum and will use price action to determine the trend. Take a look here to determine trend direction using price action.
Let’s get started with the trading system
First thing you want to do is add the MACD to your daily Forex charts and use the standard settings of 12, 26, 9. We are going to use the histogram of the MACD to measure changes in momentum.
A word about the settings, there are no best settings for a Forex strategy or any other market. Don’t waste your time looking for it.
Like I said, this trading system is going to use Fibonacci retracements on the daily chart and we will use .382, .5, .618, .786.
Daily Chart Forex Trading Strategy
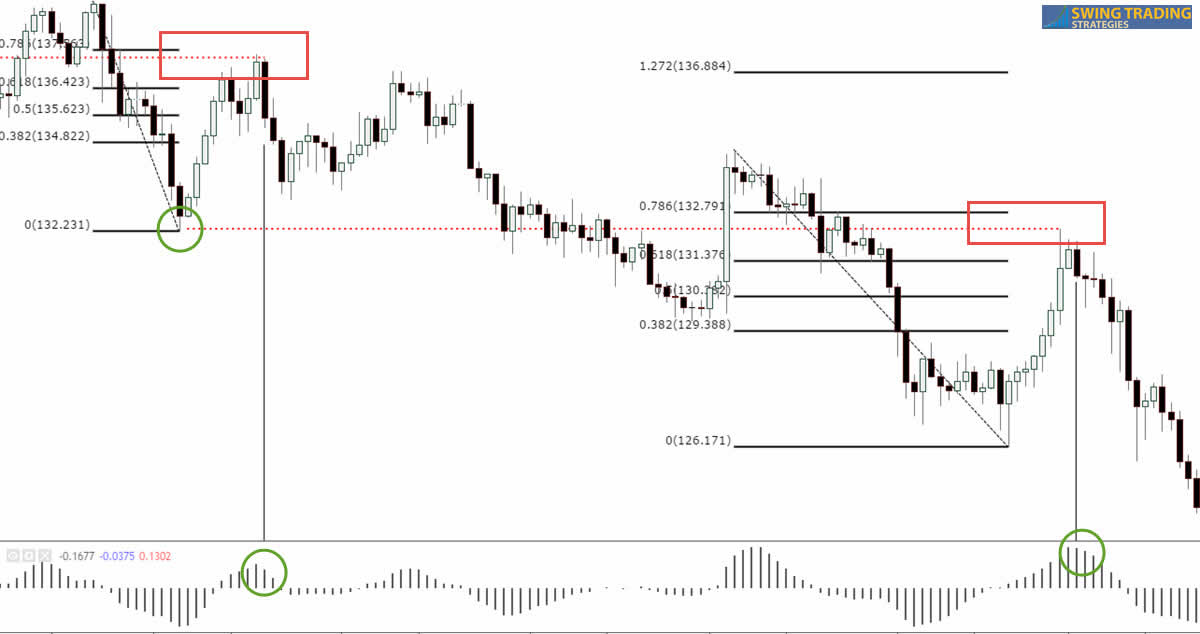
First thing we’ve done is determined through price action that we are in an overall down trend. This means we are only looking to take shorts on the daily chart for our trading strategy.
I’ve used 2 examples in this chart and just like any other Fibonacci retracement, I connect a high and low swing in the market and the Fibs laid out the retracement levels.
Another step I’ve done is looked at each of the retracement levels to see if there are any structures that I can use for confluence with the Fibs such as support and resistance levels. Those are shown with the red dashed lines and a red box envelopes both the Fib and the structure level.
The left side was cut off but this is actually a resistance level off to the left that was broken and when price broke back under it, it is once again holding up price. The green circle on the price shows the other level that was previous support.
Using The MACD For Our Daily Forex Strategy
We are using the histogram of the MACD to show us momentum. If you were to use a cross of the MACD and signal line, moves are long over.
For a short trade, we want to see a rising MACD as price heads towards the confluence zone we mapped out.
Keep in mind this: We have a trade setup once price reaches the confluence zone. What we don’t have is a trade trigger but that is next.
Once price reaches that level, we want to see the MACD histogram tick downwards indicating the bulls are weakening at this level.
The huge benefit of using a trading strategy on the daily chart is we are in no rush to do our analysis. In this example, since we are looking to short, we have this in our favor:
- Overall trend is down – found this through price action.
- Used our Fib tool and looked left around each retracement for previous price structure
- Once price rallied into our zone, we needed momentum to show indications of turning over
- Once MACD ticks down on the histogram, we enter a sell stop below the candlestick
- We wait for the trade to trigger.
You could also wait for a reversal candlestick pattern but if this is what you choose you may want to follow the following plan:
- Price enters confluence zone
- Drop down to lower time frames to find reversal candles
- Enter when reversal candlestick pattern completes
The reason to drop down a time frame is because the daily chart will hide reversals that appear intra-day.
Wait. What are we missing?
Using ATR For Your Stop Loss On Daily Charts
This part is simple. We want to use the range of the market to place our stop. This is an objective way to determine a stop loss level and can keep you out of the noise that occurs that day traders have to worry about.
We don’t want any part of that. We will let them add liquidity to the market with their constant stop outs via close stops!
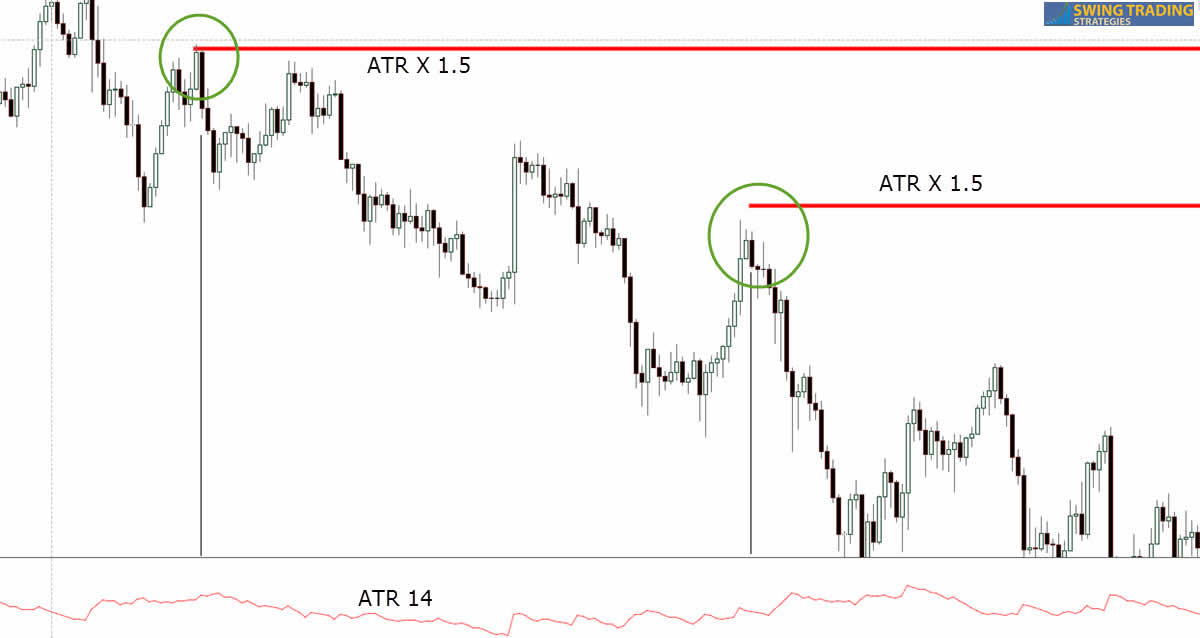
ATR STOP LOSS ON DAILY CHARTS
We are using the standard 14 period ATR (average true range indicator) and using 1.5 times that value. For shorts, we are adding that value to the low of the entry candlestick to get our stop loss price.
Formula ATR X 1.5 + low of candlestick. (For buy trades, we would subtract our ATR calculation from the high of the candlestick).
Is This Daily Chart Trading Strategy For You?
This is a very simple way to take advantage of the benefits of trading off a daily chart. Be prepared for:
- Larger stop loss in pips. Keep in mind you will STILL be trading a percentage of your account such as 2% regardless of time frame
- Not a lot of trading action
- A test of your patience to simply push buttons to get into a trade.
- Lower transaction costs because you are not trading as often
- The potential for more pips than you could ever imagine in one trade.
Updated 2017
 Posted in