


Exit profitable trades is the objective of all trading right? Let’s take a look to see various ways we can accomplish just that.
At the end of October we took a look at the monthly EURUSD chart and saw a break of a wedge formation. You can see what we wrote back then in this post. We suggested that you wait for a pullback to the lower trend line to enter the trade. We got one on October 26th. For the entry we waited to see a red bar close and placed our entry below the low of that bar. This happened on the following day. Here’s an example of how you can exit profitable trades.
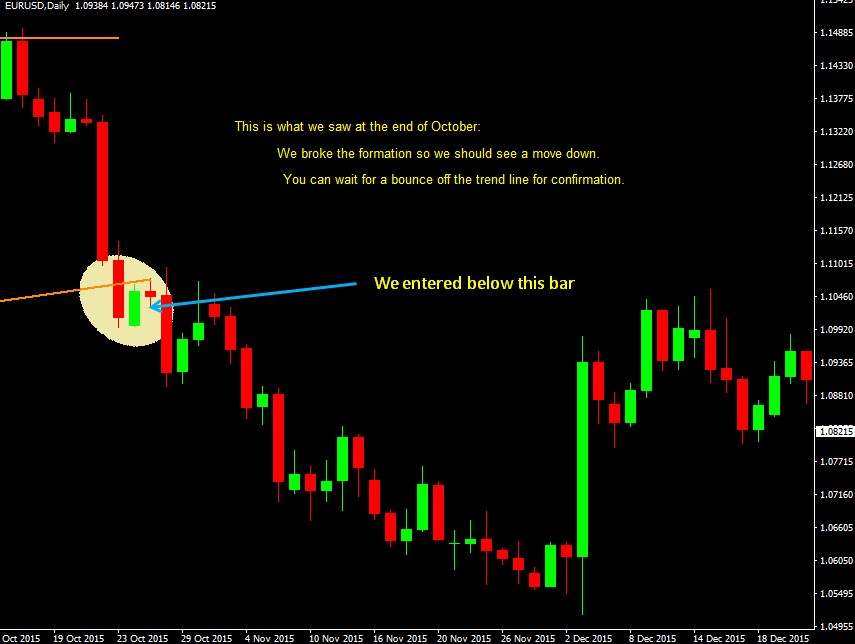
Entry after pullback to bottom of wedge formation
Exactly where you placed the entry will depend on how much confirmation you want. The simplest entry would have been at the close of the red confirmation bar (1.1013). A more conservative approach would have you placing your stop entry order below the 1.100 level, which also happens to be right below the low of the bar (1.0999). I took the more conservative approach.
The first thing you need to do when placing a trade is to put a protective stop and a target order in place. This is essential to exit profitable trades eventually.
At the close of the red setup bar there was no convenient swing nearby and since the setup was somewhat small I opted for the high of the last three bars as my initial stop. This was the bar from October 23rd (high at 1.1139). I placed the target at the low of the monthly formation, 1.0470.
With my entry, protective stop and target orders in place it was time to plan my trade management approach. Assuming the setup triggers how will I manage the stop?
Trend Line
The simplest approach is often the best. I drew a trend line from the October 15th and October 22nd highs and extended it. I would keep my initial stop in place and trail the trend line once it moved below the initial stop. After that I would exit the trade on any close that broke the line. On December 1st price closed above the trend line and I moved my stop right above that bar (high of 1.0636). Two days later my stop was hit.
An alternate approach would have had me exiting on a touch of the prior day’s trend line which would have had me exit profitable trades at 1.0606 for a slightly better profit. There’s a risk here that you might get stopped out on random noise which is why I like trail my stop several pips above the trend line and then wait for the trend line break.
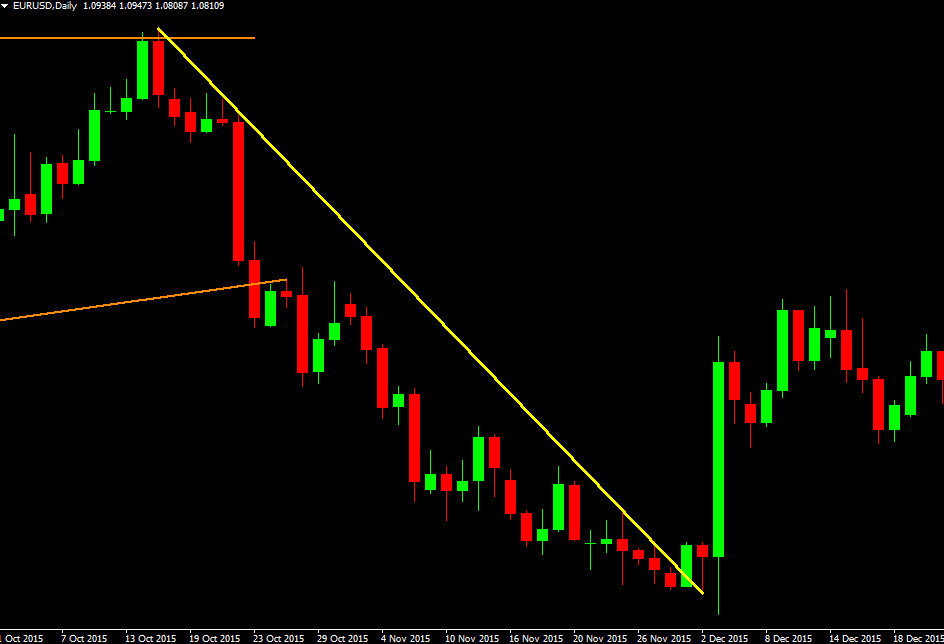
Exit the trade after a close above the trend line
You can review this article on trend line breaks for more examples.
Swing Levels
In a trending market another simple stop management method is to use swing levels formed by price retracements. Whenever a new swing level is formed we move the stop down.
Since the definition of a down trend is a series of lower swing highs and lower swing lows this approach could keep us in a trade for the long haul. It tends to give the trade more room to retrace than the trend line approach but because of that the stops will also be hit later and yield smaller profits.
You can see in the chart below how I would have made only three adjustments to my stop after the initial setup. For this trade the stop would have been about 130 pips higher but still yielded a very nice profit.
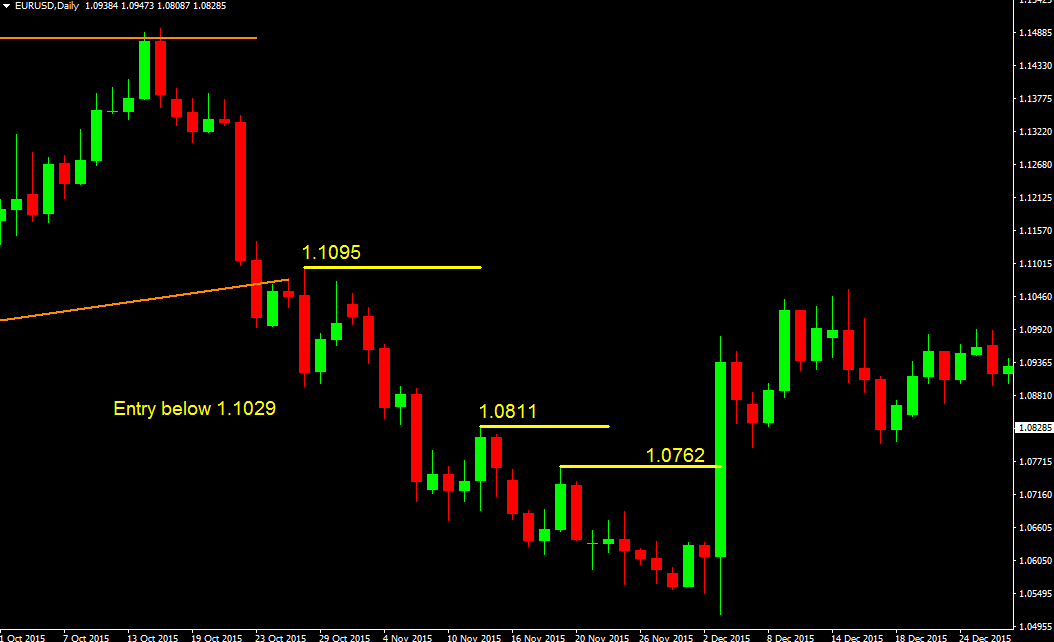
Stop trails each new retracement swing high
We also cover this approach to stop management in our 50 EMA Swing Trading System.
Parabolic SAR
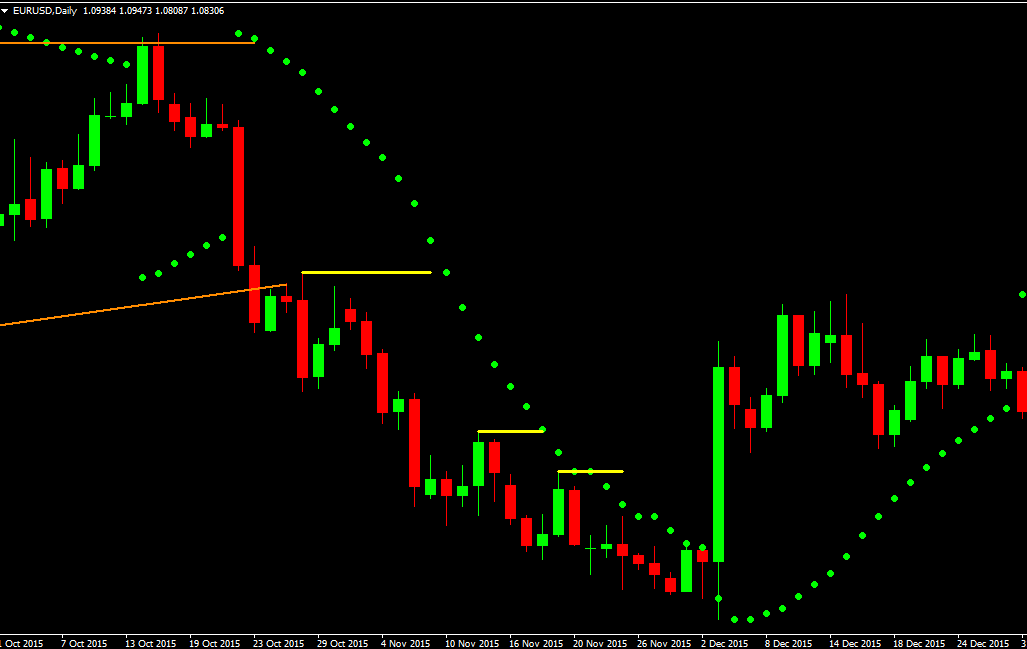
The parabolic SAR indicator places its initial stop above the recent swing level and then gradually tightens the stop as price advances. It gives the initial trade plenty of room to room to chop around but once it starts moving the stop gets ever tighter. It works very well with breakouts and you can read more about it in our Parabolic SAR Indicator Trading Strategy. You can see how well this stop would have worked in this picture:
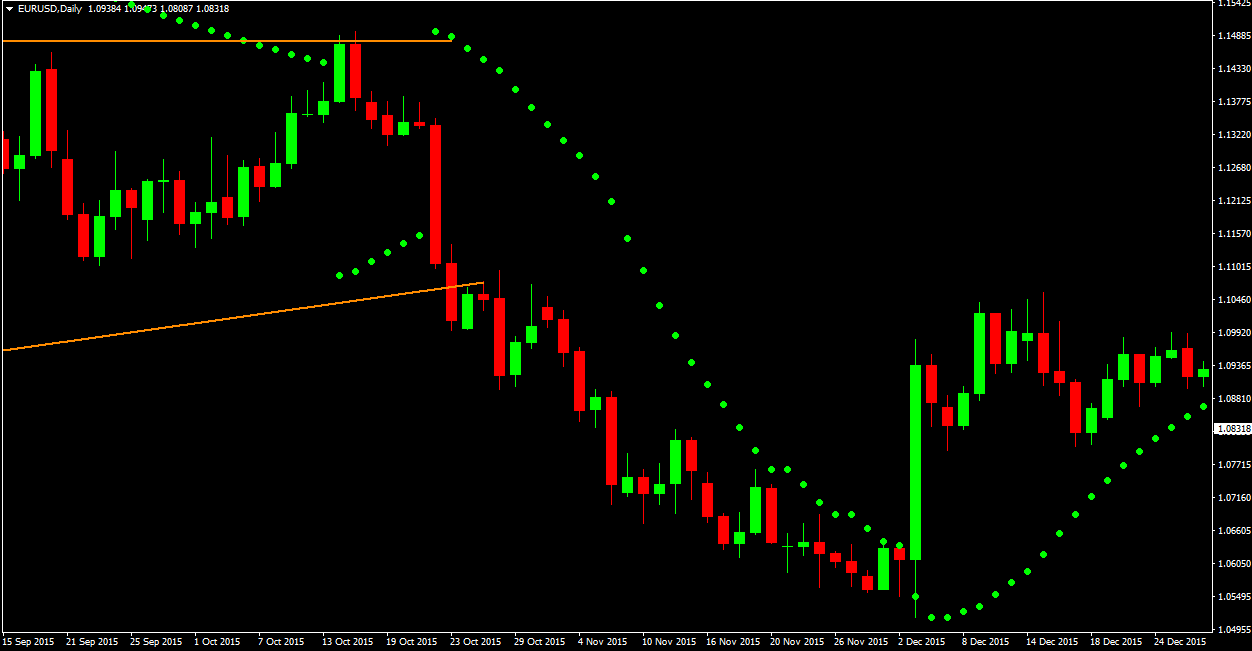
Parabolic SAR stop tightens as the trade progresses
To use the parabolic SAR you would have kept your initial stop in place until the parabolic stop moves below it, and from then on you’d simply adjust your stop daily based on the value of the indicator. The final stop placement in this case was at 1.0636, a few pips below the trend line exit we described above.
Mix and Match
I like the parabolic SAR stop very much but don’t like the fact that it can take quite a while before you eliminate the risk on your trade. In the EURUSD we entered the trade October 28th and it wasn’t until November 11th that the parabolic stop dipped below our entry level. That’s why I would have kept my initial stop in place until then.
I like to combine the SAR with a secondary strategy that has me locking in profit earlier, such as the swing level stop. The swing levels had me tightening my stop three times before the parabolic stop finally caught up on November 19th. Once it did it ended up giving me a much better exit than I would have had with the swing level alone, about 130 pips better. You can see what this looks like below.
Swing level stop is combined with Parabolic SAR to lock in gains earlier
Conclusion
There are many more approaches to managing your stop once you’re in a trade. It’s key in particular to exit profitable trades since this is the outcome we’re all after. You can switch to a lower time frame chart, like a four hour or one hour, and then apply a trailing 50 EMA stop for example, or you can look for lower time frame support and resistance levels to plan your exits.
And of course you can combine some of our other systems. The key is to minimize your initial risk and start locking in profits without risking stopping out due to simple market noise. And as always, keep it simple.
 Posted in