


Today we’re going to look at the EURUSD and see what we can expect from it.
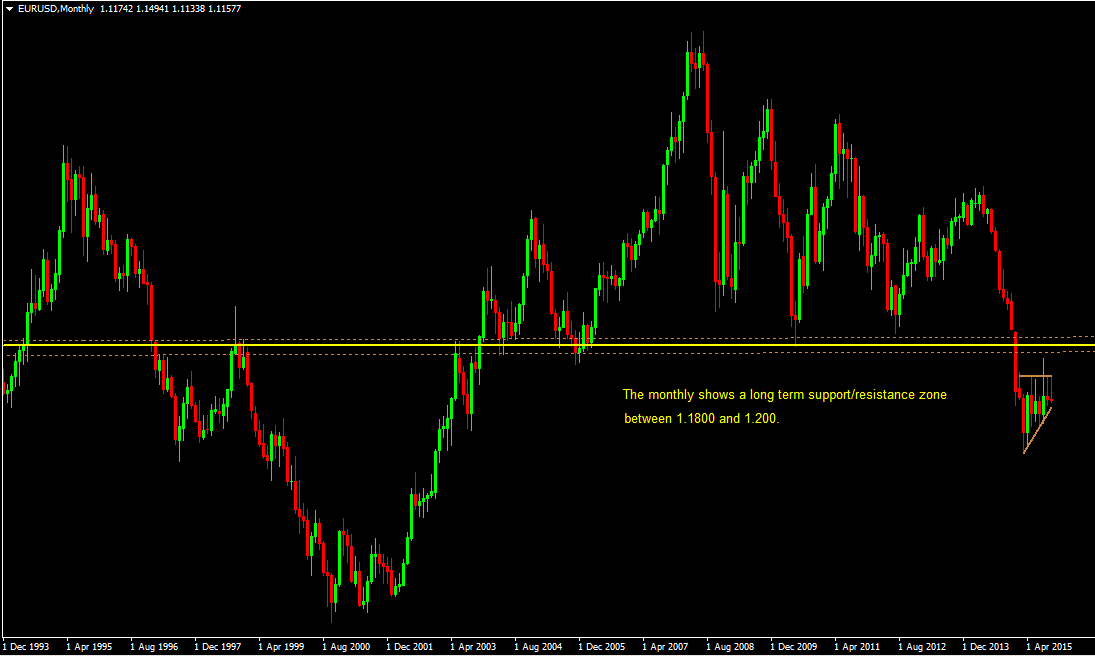
I started writing this post last week. At that time I took a look at the monthly chart to put the pair in perspective. You’ll see from the chart below that over the last couple of decades a significant support/resistance zone has formed between 1.1800 and 1.2000. For more than ten years price has held above that level, until it was finally broken earlier this year.
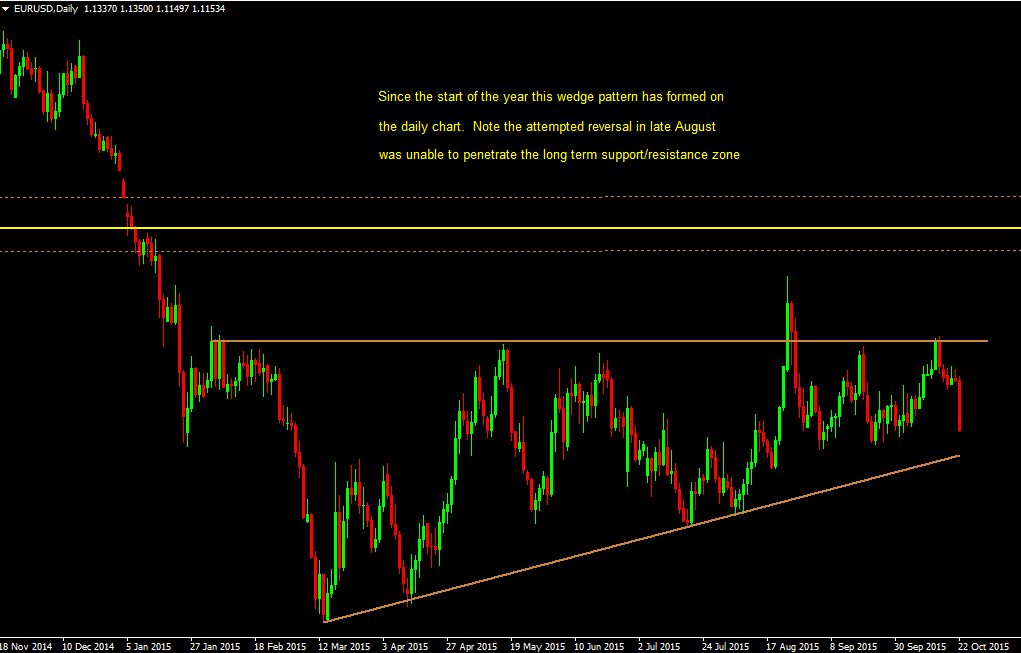
We often see that once a support/resistance zone is broken price will retrace and consolidate before resuming its move. You can see that very clearly in the following chart. After breaking through with conviction in the first quarter of the year we’ve formed a wedge shaped consolidation pattern. There was an attempt in August to break back through the zone but it was easily pushed back and the consolidation has resumed.
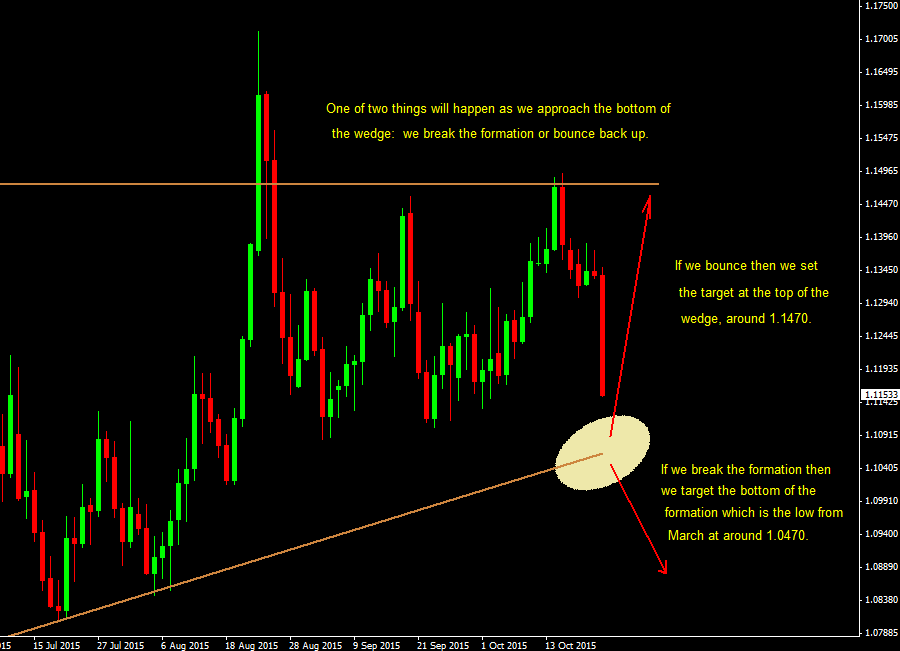
I said I started writing this article last week. At that time the price action was still contained inside the wedge pattern and I was expecting one of two things to happen:
- Price would touch and bounce off the bottom trend line. If that was the case then we’d apply the trend line trading strategy and look for a move back to the top of the formation.
- Price would break through the bottom trend line. We would then apply the trend line breakout strategy and look for an extended move down. For an initial target we’d use the low formed at the beginning of the wedge pattern, back in March.
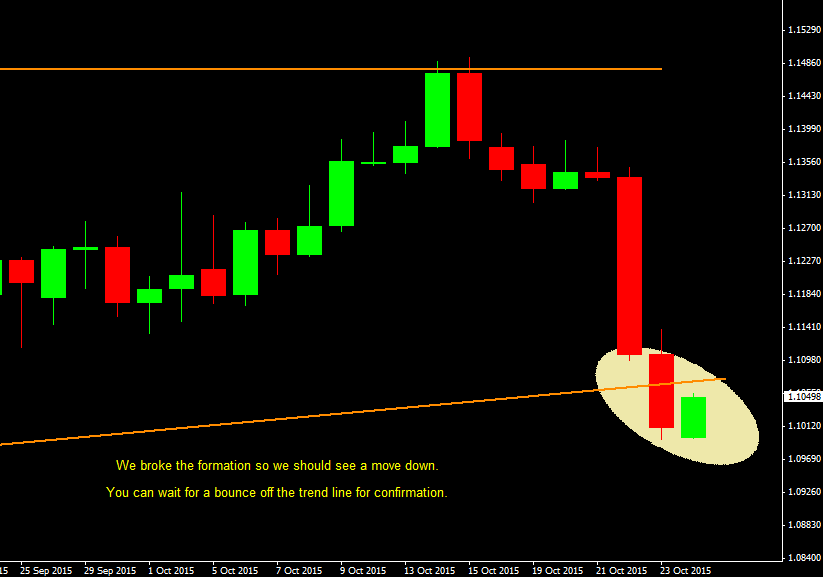
This is where things stood last Thursday. On Friday we finally closed below the bottom trend line suggesting a further move down. You can see in the chart below that we’re getting a pullback to the trend line. I would like to see this pullback get rejected at the trend line with a strong close below it as that would confirm the break for us. For additional confirmation you can look for one of the bearish candlestick reversal patterns on a lower time frame, like the four hour chart.
This could turn into a very nice trade. The first significant level will be the low formed back in March, around 1.0470. Expect some price consolidation and possible retracement there. If you look back at the monthly chart however you can see that if we break this level there is very little standing in the way of an extended move down to the support/resistance zone around 0.9500 and eventually the multi-decade low just above 0.8200.
Don’t forget to manage your trade, reducing risk as price continues to move. Once you’ve locked in a profit you may want to consider booking some profit at the first target level but trailing another portion for a possibly huge winner.
 Posted in