


Did you know that one very simple, yet very effective way of determining the end of a trend has nothing to do with moving average cross-overs or stochastic being oversold or overbought or any other forex indicators? Moving average indicators only shows you the fact after it has happened…because they are lagging indicators.
Did you also know that you do not need price action structure analysis to determine if a trend is ending or not like breakouts of highs and lows?
Is this something new I’m going on about here?
No, I don’t think so. The fact of the matter is that you may have seen it…
You may have come across this concept but you like many others just gave it a passing glance and never really bothered to investigate further to really fully understand how this simple forex trading technique can really improve your chances greatly of being on the right side of the market when making a trade.
WHY YOU SHOULD KNOW IF A TREND HAS ENDED
If you are using a trend trading forex system, would’t it be important that you must be always trading in the direction of the trend?
Yes. Why is that? Well, here’s why:
- What happens if you don’t know if the trend is up or down? Well, that means you will be blindly taking a trade without knowing which direction the price is most likely to be headed.Now, the fact of the matter is this: if you take a trade at the very start of a new trend (which is the end of the previous trend), you stand to make a lot more money (profits) if the trend is strong and continues with a strong momentum. Or if you can just find a way to get into a trade just after a new trend has started, you also stand to make a lot more profits if the trend is strong and continues for a long time.
- trading with the trend is also about having the odds on your side.
Well, so what’s the solution then? The solution lies in a line…As a matter of fact, its a trendline break.
(I recommend this forex trading strategy that describes trendline trading and trendline break trading in a lot more robust detail than this post. You can buy it here. I’ve given a review of it here).
WHERE DO TRENDS END?
Trends can end anywhere! But they can also end at:
- support levels
- resistance levels
- Fibonacci levels
- touch of trendlines
Now, if you can enter a trade at the very start of a new trend (which would be the end of the previous trend), it would be like picking tops and bottoms, right?
Exactly!
You see, some traders will say that say that picking tops of bottoms of trends is a myth, it can’t be done.
Really???
I totally disagree and here’s why: I emailed many of you who are subscribed to may email list about these 7 forex trading signals setups that were happening and told you to watch out for them.
These kinds of setups can allow you to take trades at the tops or bottoms right at the moment when a trend is ending and a new one is starting.
Lets see how each of those trading setups have turned out? Did any trades setups happen or not?
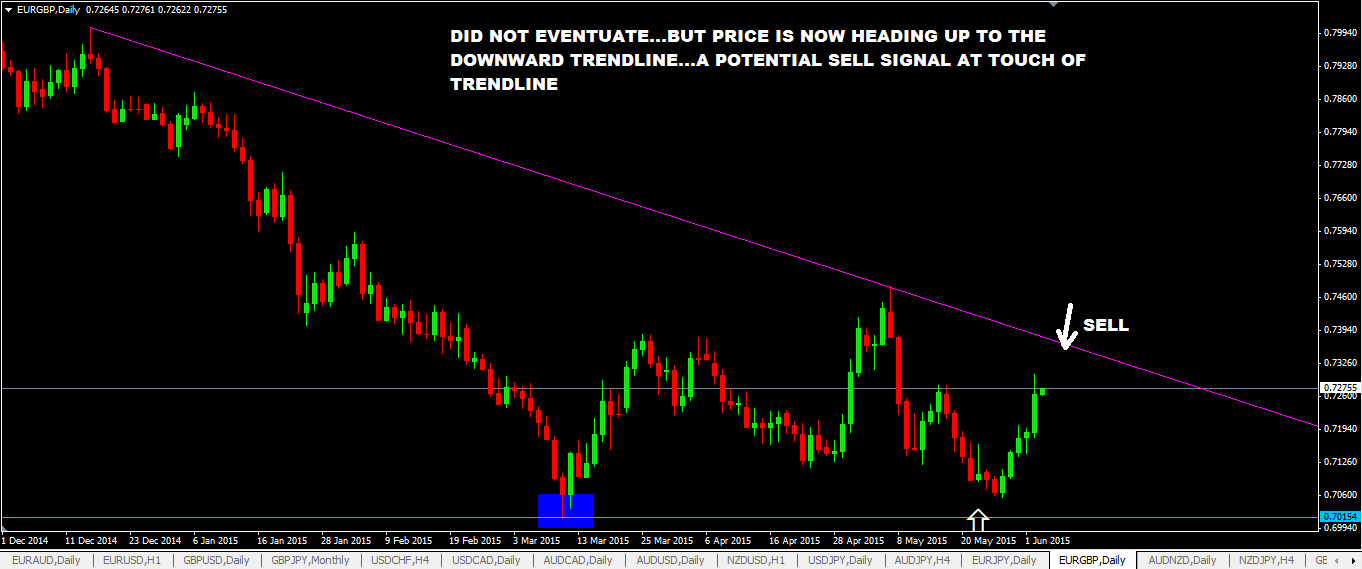
#1:BUY TRADE SETUP EURGBP
Before:
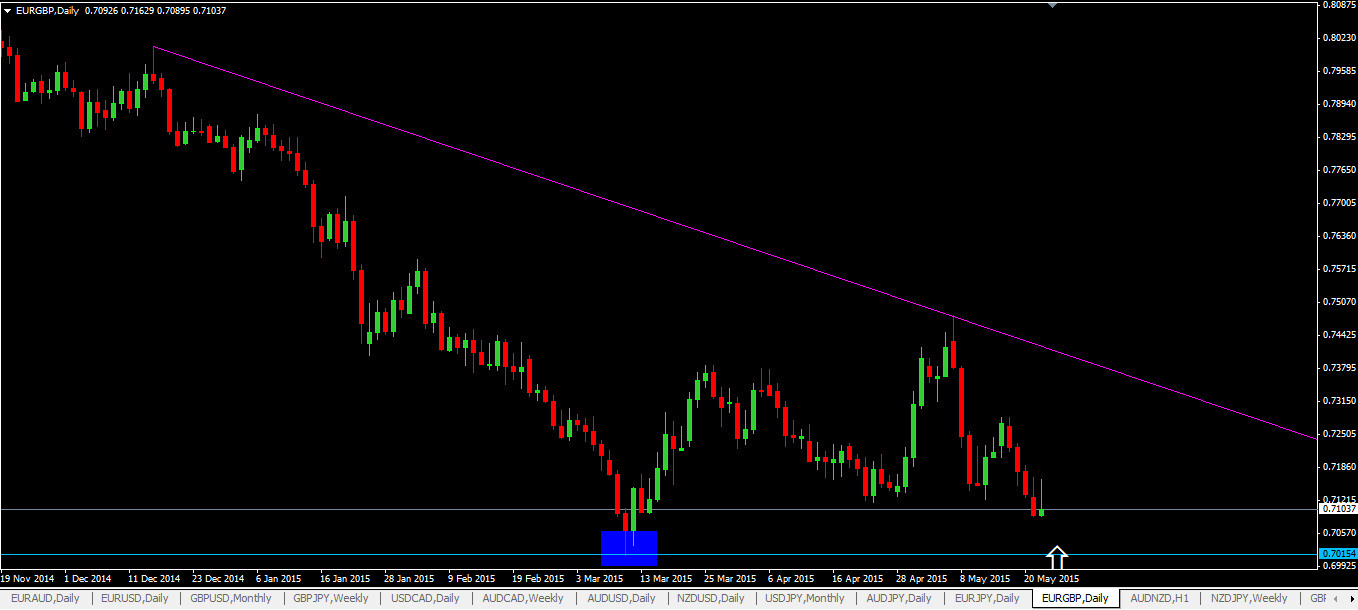
Now:
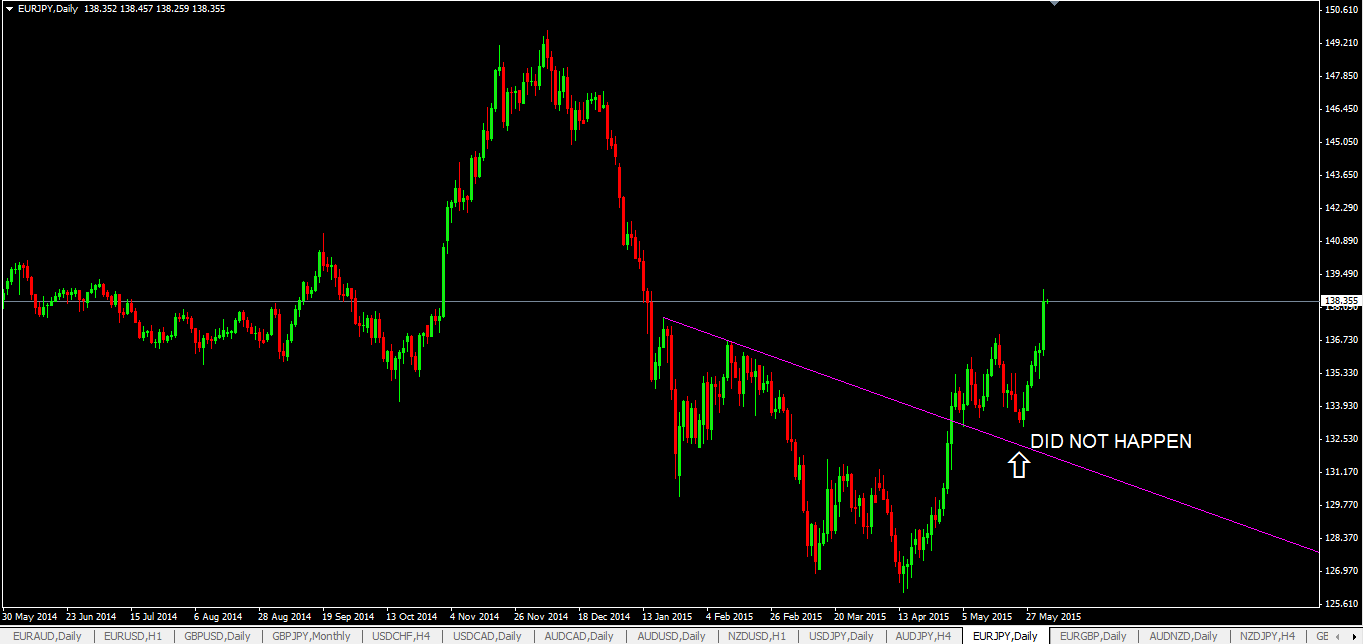
#2: EURJPY BUT TRADE SETUP
Before:
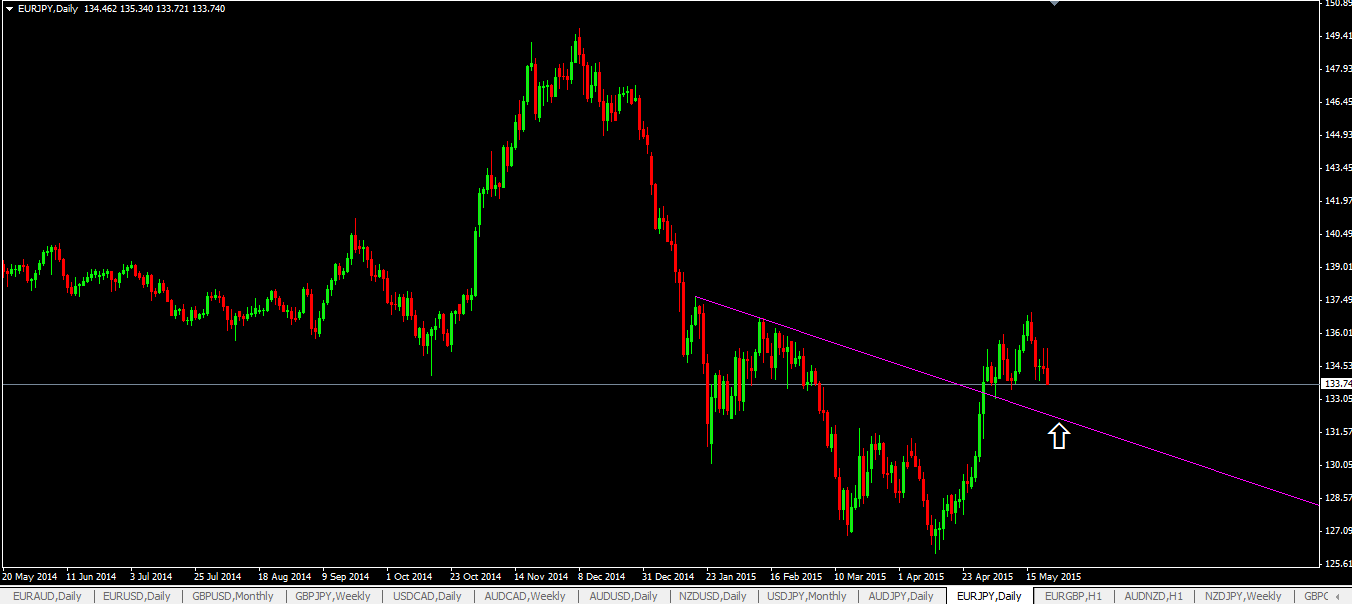
Now:
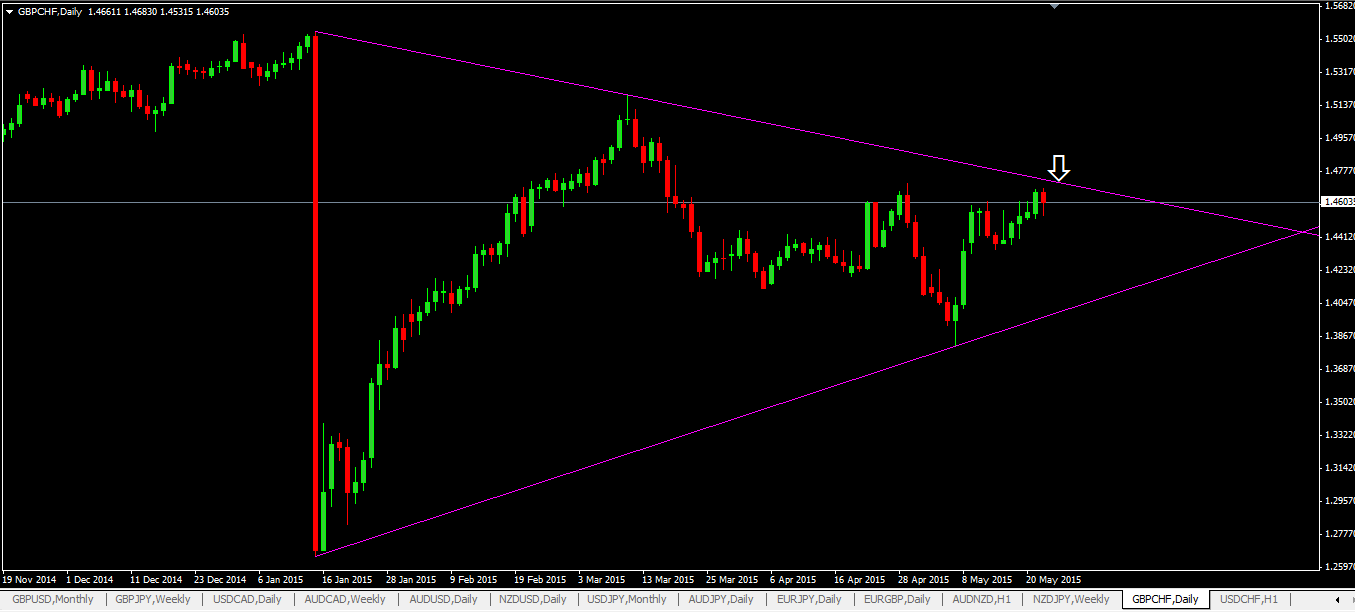
#3:GBPCHF SELL TRADING SETUP
Before:
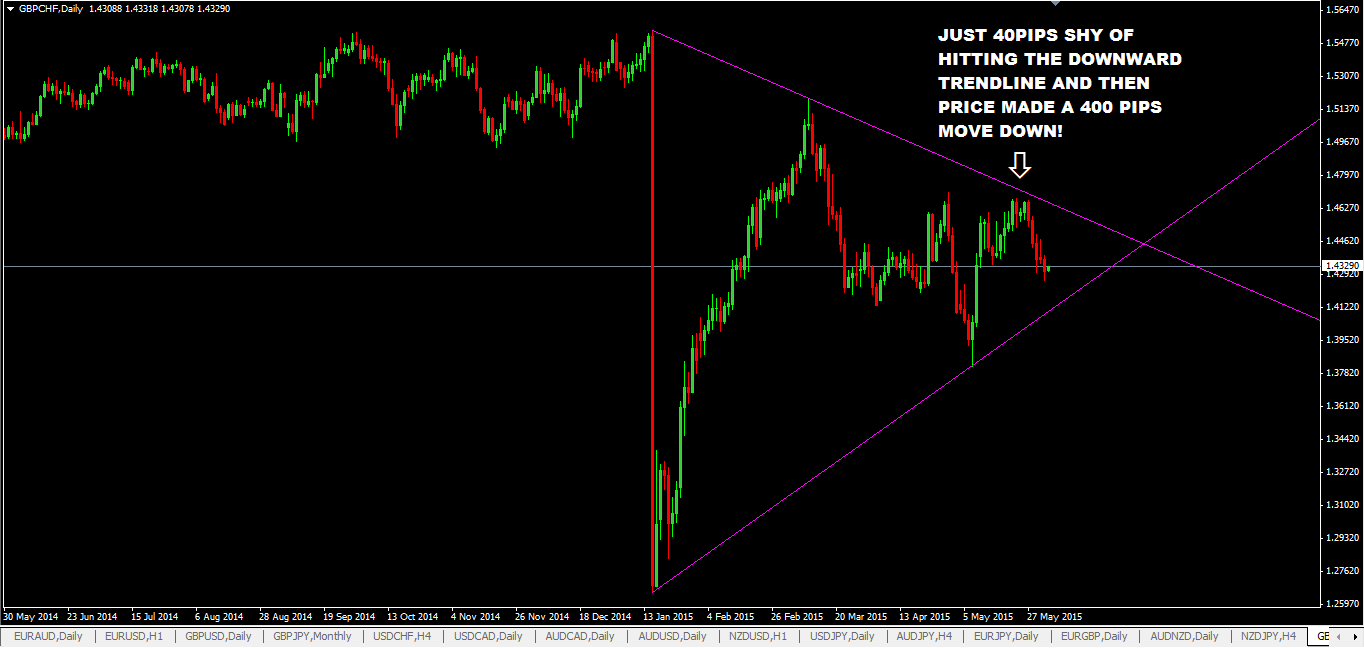
Now:
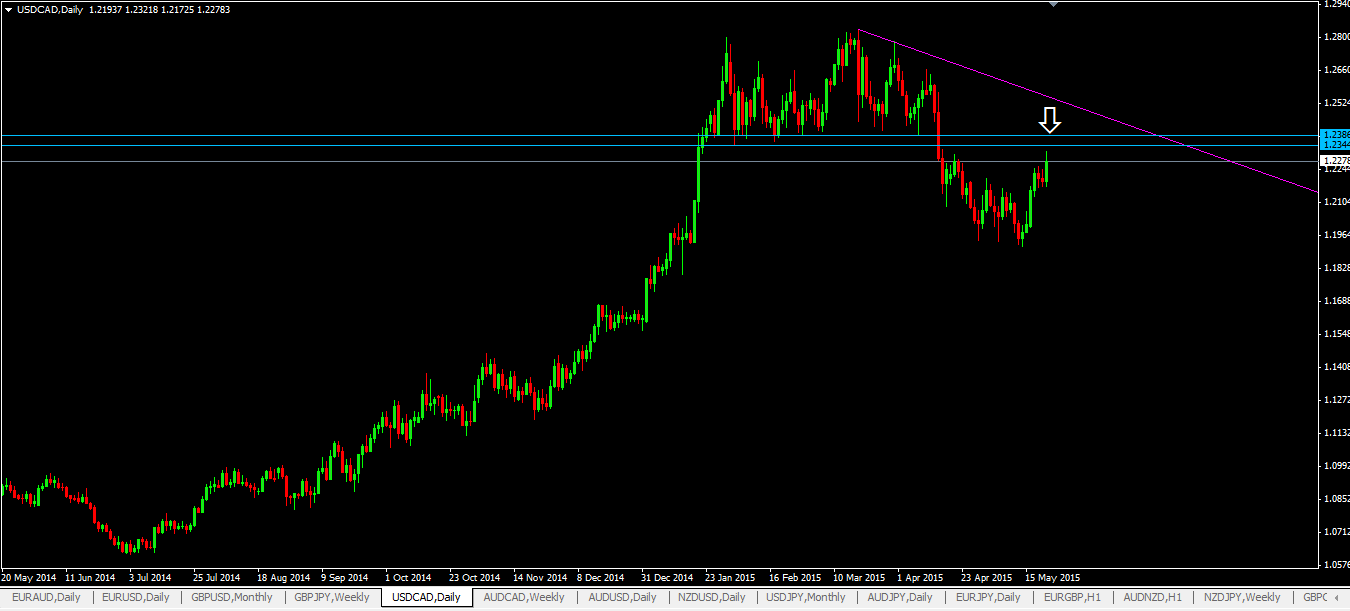
#4: USDCAD SELL TRADE SETUP
Before:
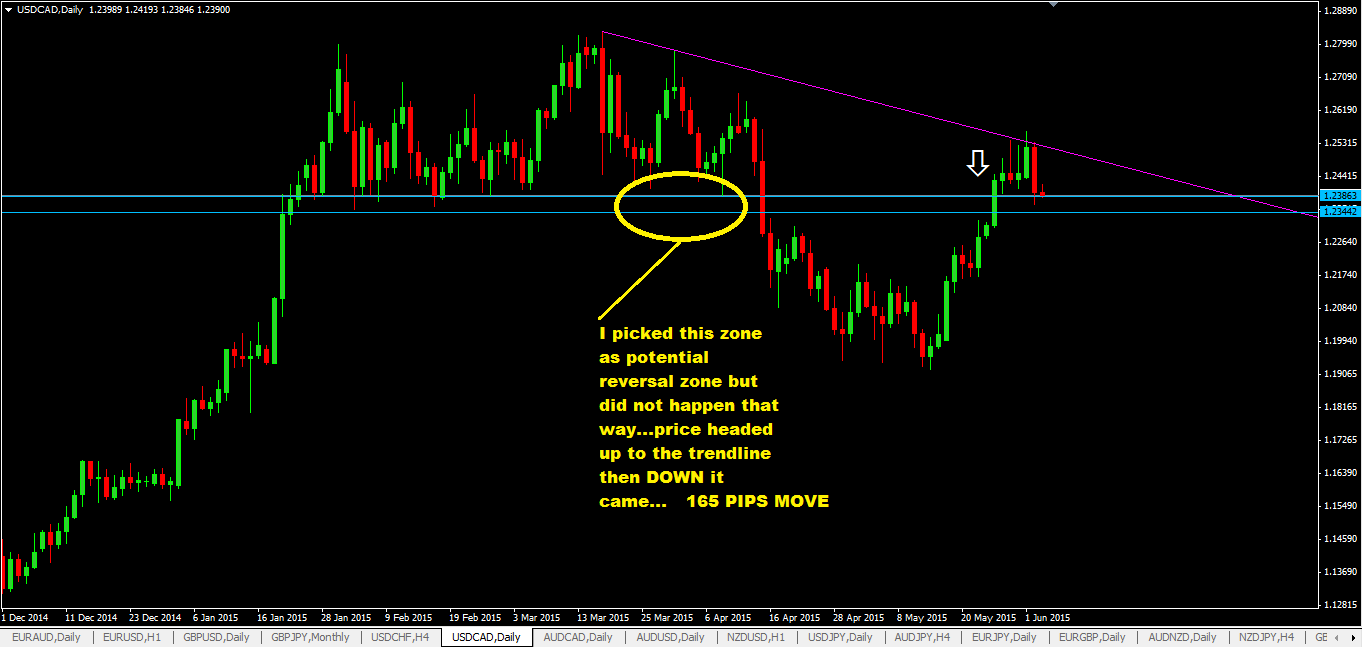
Now:
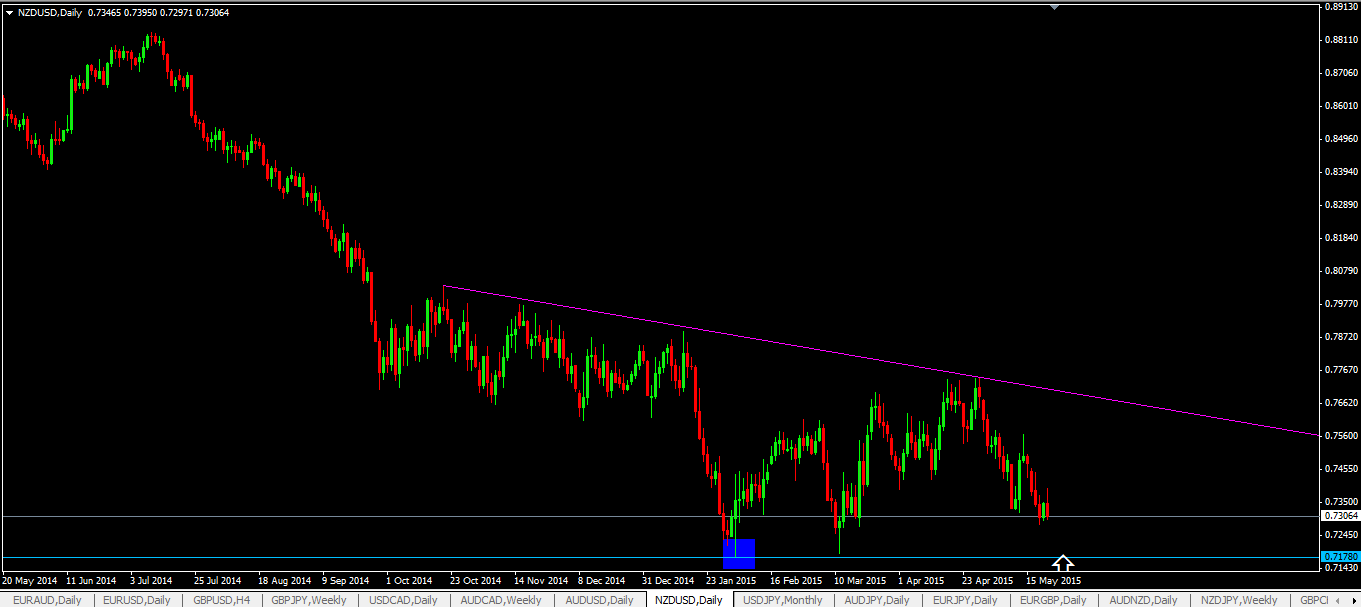
#5: NZDUSD Buy trading setup
Before:
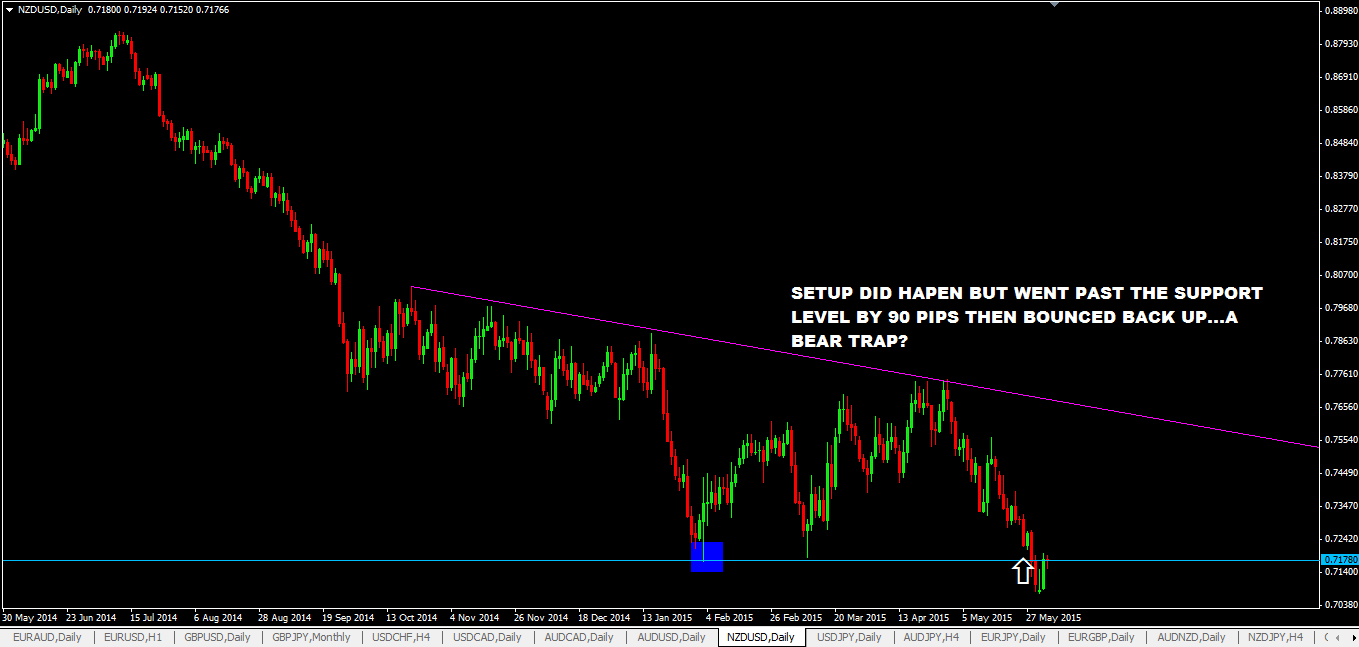
Now:
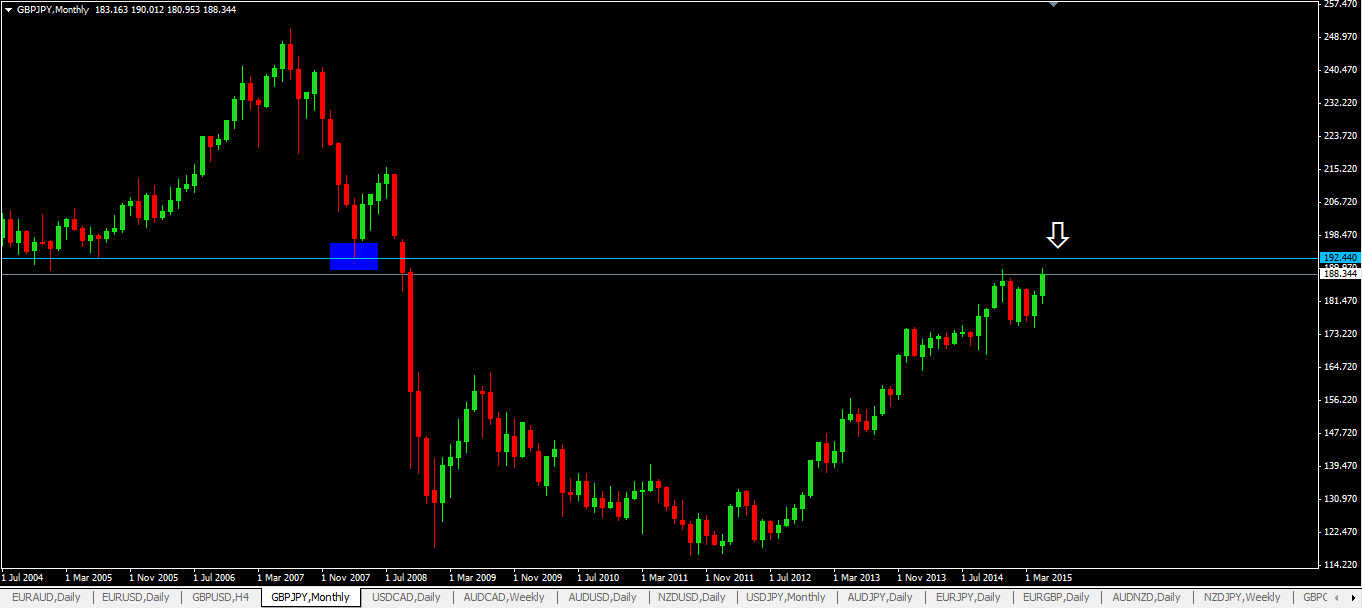
#6: GBPJPY Sell Trading Setup
Before:
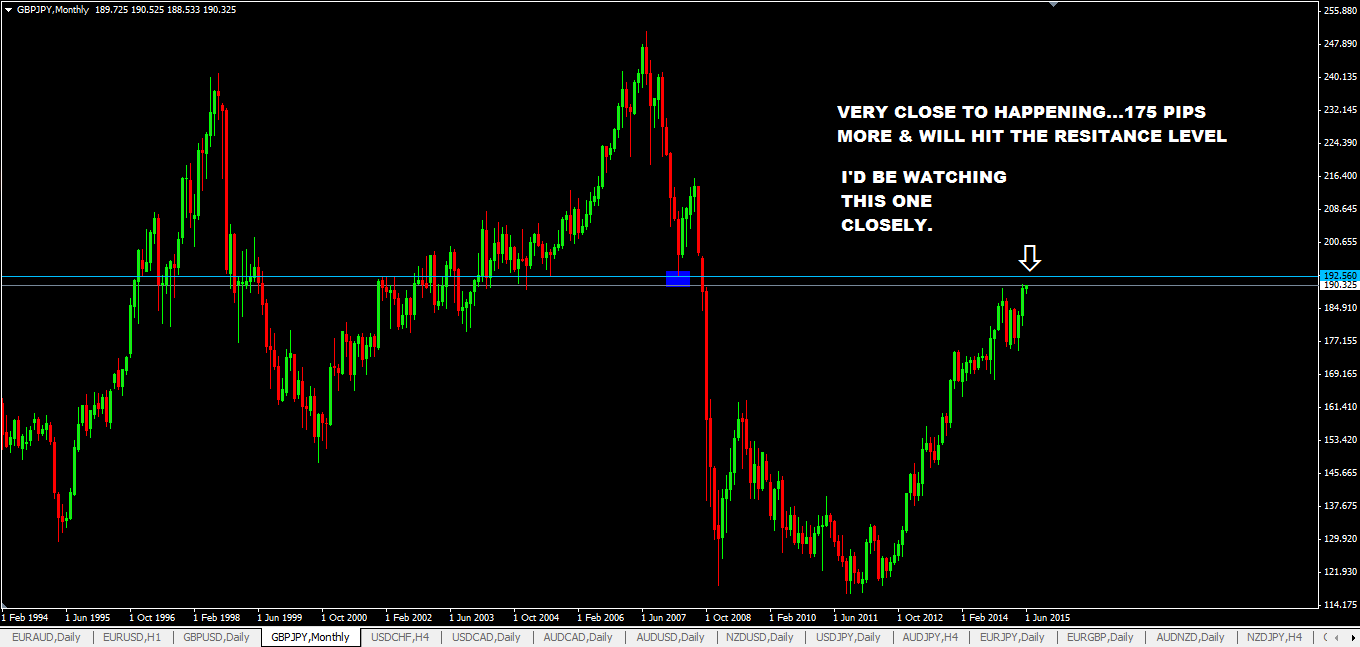
Now:
#7: USDJPY SELL TRADE SETUP
Before:
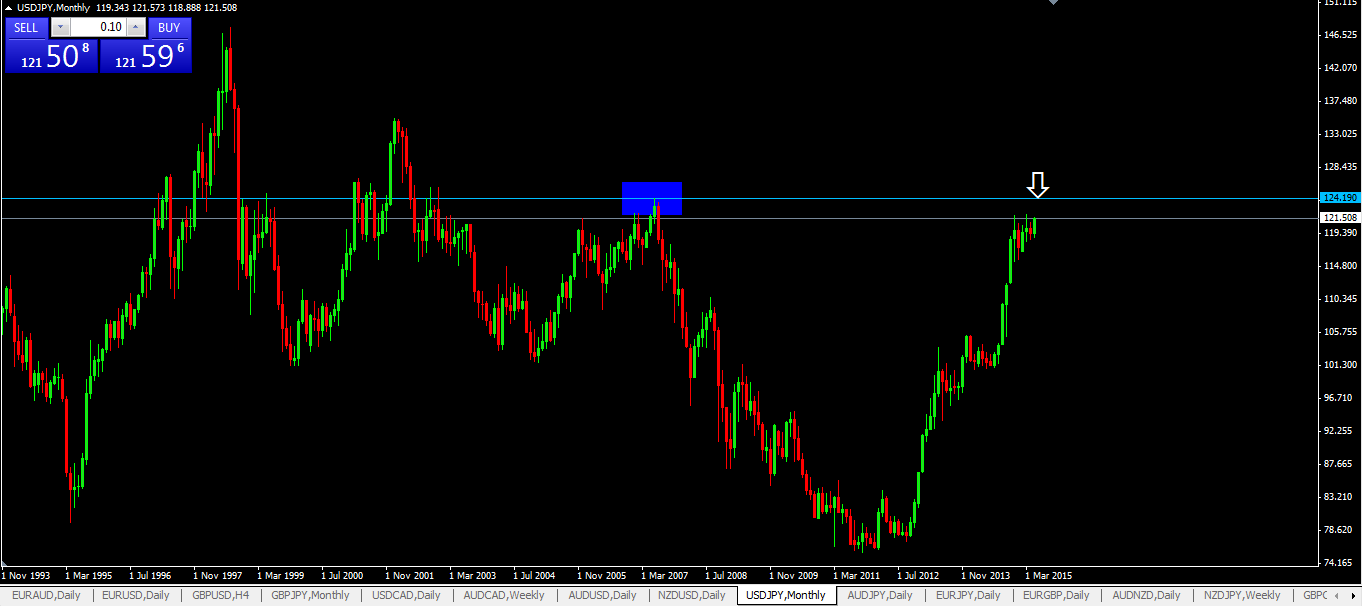
Now:
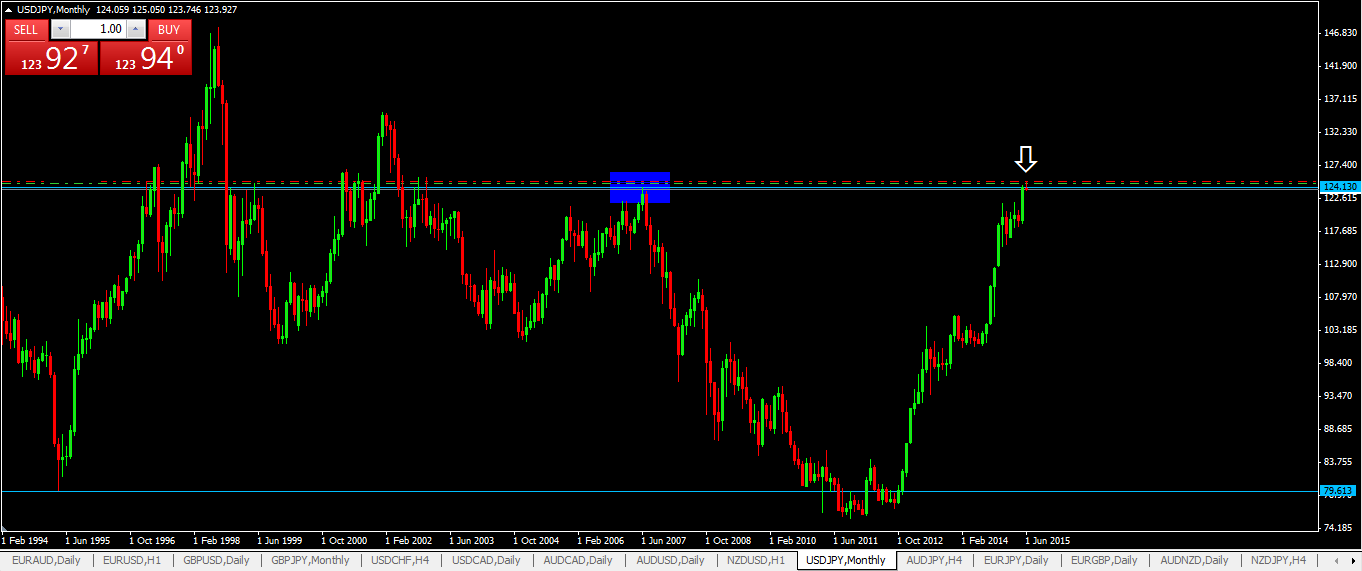
Now, did I sell at the top on USDJPY? Yes, I did. Was it EXACTLY at the top? No. Price moved by at least 90 pips up from the resistance line seen in the monthly timeframe before falling back down. Now, if price where to fall way back all the way down and If seen from the daily, weekly or monthly timeframe, you will say that I picked the “exact top” to sell.
Ok, here’s how I entered this trade on the 1hr timeframe, in case you are interested. The chart is self explanatory.

Those 5 bullet points I’ve listed above: that’s what I use. That’s how you can pick top and bottoms not exactly to the dot but with plus or minus certain number of pips. You can’t really be exact anyway.
Now, do I have a 100% success rate in picking tops and bottoms? No. That’s not important. Heck, even I can have a 30% success rate at picking tops and bottoms but end up still in the positive territory with one or two trades that go according to plan.
How?
Answer: because of the risk:reward ratio of picking tops and bottoms are really GREAT! (whilst keeping your trading risk/loss at a minimum)
I’ve had trades that have giving me risk to reward of 1:10 in such situation and this is on the extreme high end. But on average 1:5 seems to be more easily achieved.
TRENDLINE BREAKS
Trends never last forever. Guys and Girls, here’s something I’ve witnessed time and time again. When price breaks a trendline, you’ve got to at least sit up take notice. This may be the start of of a new trend (which means the previous trend may be ending).
But before we get more into it, here’s the thing you need to understand about trends:
- there’s trends in smaller timeframes like 1min, 5min & 15min
- there’s trends in medium term timeframes like in 1hr and 4hr timeframes
- there’s trends in larger timeframes like the daily, weekly and monthly
Each timeframe will have its own trend. At any one time, the trends in these timeframe may be against or going in the same direction.
Now, the trends in the smaller and medium timeframes may be going about in their own little trends here and there but the overall movement they make would be in the direction of the main trend.
Therefore, in a similar manner, you can draw trendlines in all timeframes. And they may not necessarily go in the same direction.
But you only need to draw trendlines in the timeframes that you are going to trade in or only if those timeframes that will influence your trading decision. Because it does get a bit messy if you have trendlines crisscrossing each other on your chart.
LETS GO BACK TO THE PAST…
The past reveals what can potentially happen in the future…Now, its easy to say that this happened here because of that AFTER the fact. Its easy to count the pips after price has moved and has become history.
The greatest challenge for any trader is trying to see what is happening in real time when you are watching your trading charts and being able make trading decisions based on what is happening at that moment. You can’t trade the yesterday, you can only trade today but today will be tomorrow’s past.
But anyhow, we still need to study the past, as this prepares us for what may be happening now or in the future.
Let me show you a chart of trendlines breaks so you begin to see and understand what I’ve been ranting about in here:
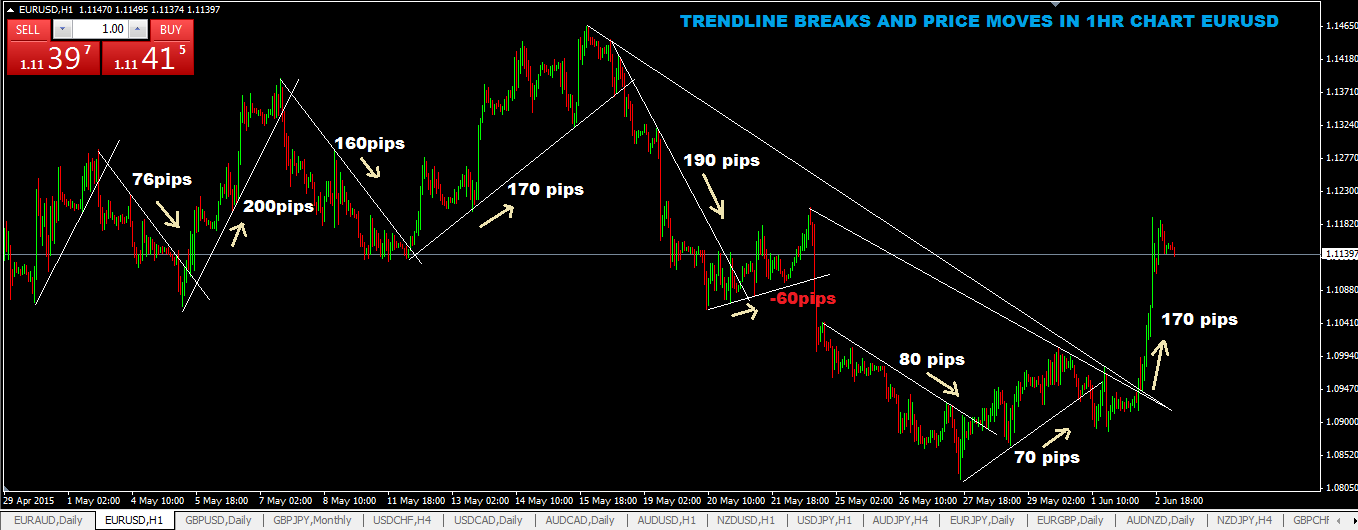
HERE’S A FEW POINTERS
- note from the chart above that when the price broke the trendline, the trend did in fact change and note that some of the moves were big and others were small.
- now, this gives you are fairly good idea that everytime price breaks a trendline, you should take notice and incorporate it into the trend trading strategy you are using.
WHAT ELSE CAN THE TRENDLINE BREAKOUT BE USED FOR?
As a trade management tool. How? Let me explain: you can use the trendline breakout as your signal for getting out (exiting) a trade.
Lets say that you enter a buy trade based on the floor traders method forex trading system or used a support and resistance trading system, you can use the the trendline to:
- keep staying in the trade as long as price does not break it
- and as soon as it breaks it, that’s your signal to exit the trade.
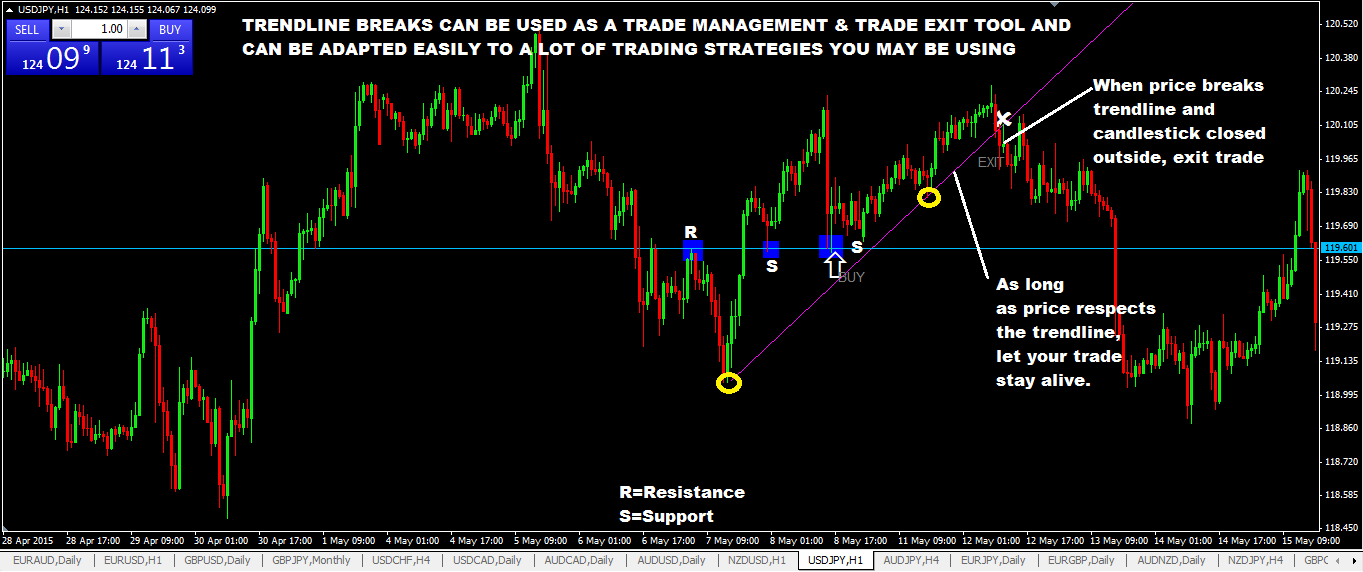
After you enter a buy trade, wait for price to create lower swing points of increasing height, which you can use to draw the upward trendline. As soon as price intersects this trendline and you see a candlestick close below the trendline, you move your trailing stop loss and place it a few pips below the low of that candlestick. If price continues down, you will get stopped out and walk away with a profit, if it does not and continues to move above, then keep riding the trend.
WHAT YOU HAVE TO DO NOW IS THIS
- go over your charts and learn how to draw trendlines on past price data and observe what happened when the the trendline was broken…did the trend change?
- how many pips was the price move until another subsequent trendline was broken?
- switch between small to larger timeframes and play around with trendlines and try to make some sense of it.
It would mean the world to me if you can click those buttons below to share and tweet this post to your friends, I bet they would thank you heaps for pointing this site out to them.
 Posted in